Yields May Be At or Near Their Peak
Introduction
Bond yields may be near their peak or may have already peaked. If so, and the path of least resistance is down, there are ramifications.
Generally, yields have appreciated off the narrative that the Fed will keep yields "higher for longer" in their battle against inflation. The US10Y traded at a year-to-date low of 3.25% at the beginning of April and ran rampant to over 5% by October, before pulling back since then to trade near 4.88%.
Daily Negative Divergence
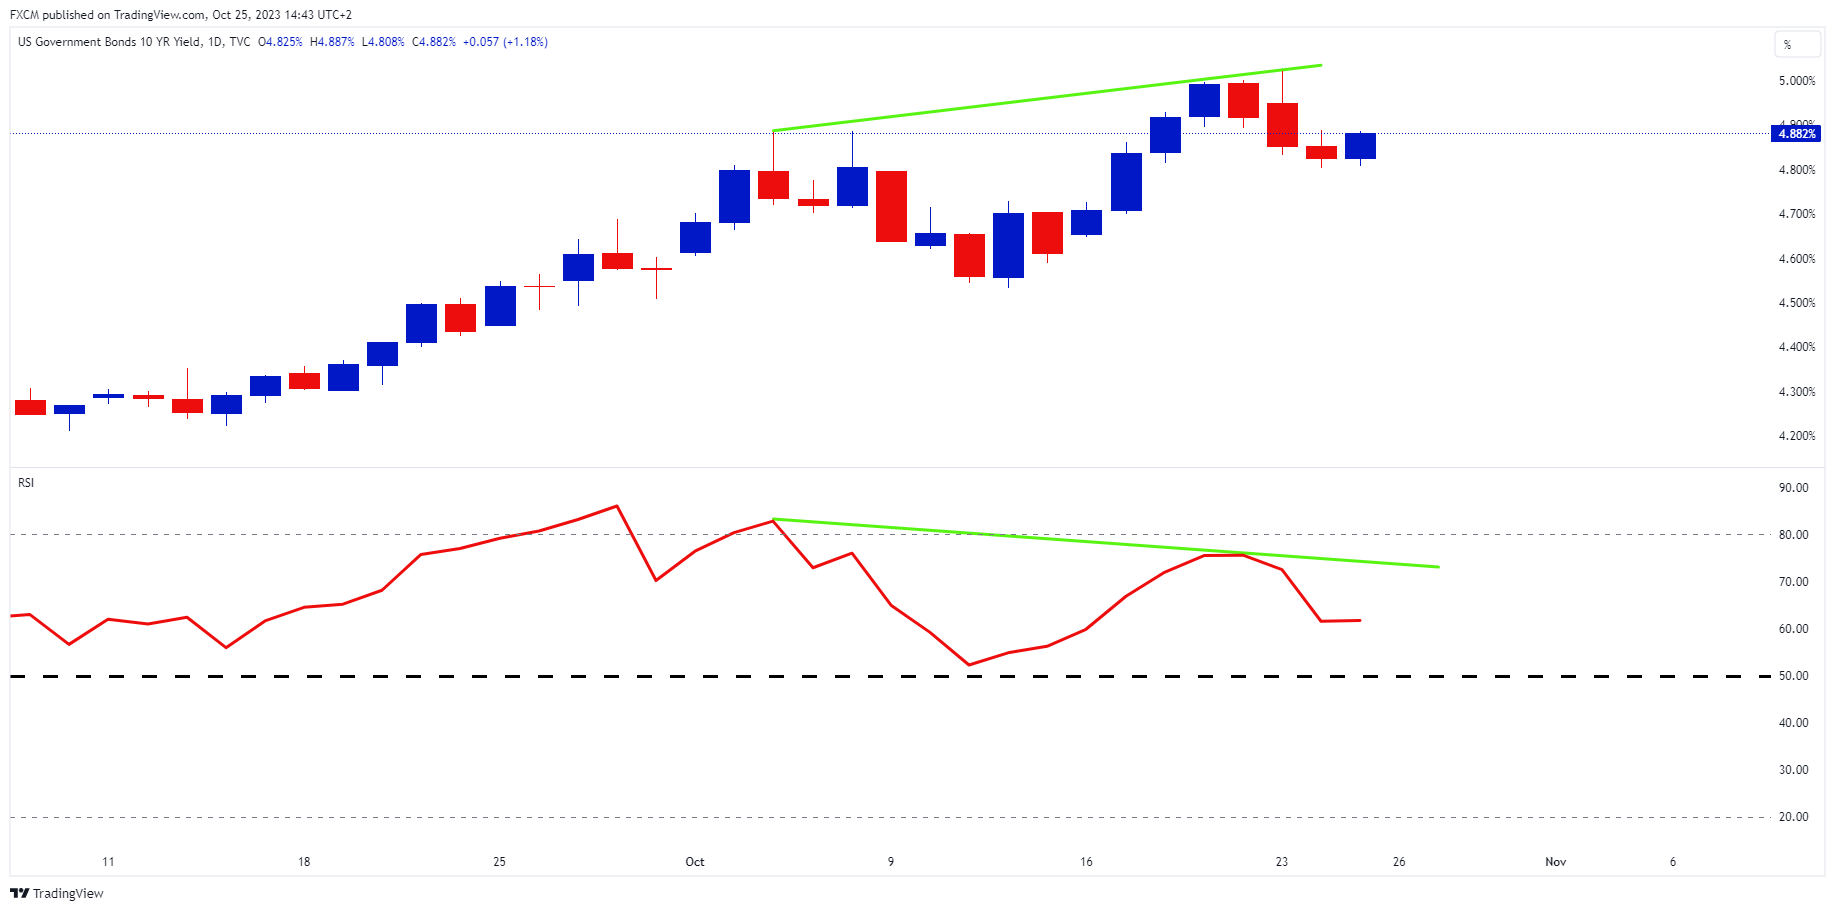
Source: www.tradingview.com
Technically, the US 10-year yield, on the daily chart, is showing a negative divergence. This suggests that the upwards momentum in yields is waning. This makes sense when we consider the US 10-year yield's weekly chart.
Weekly Overbought Condition
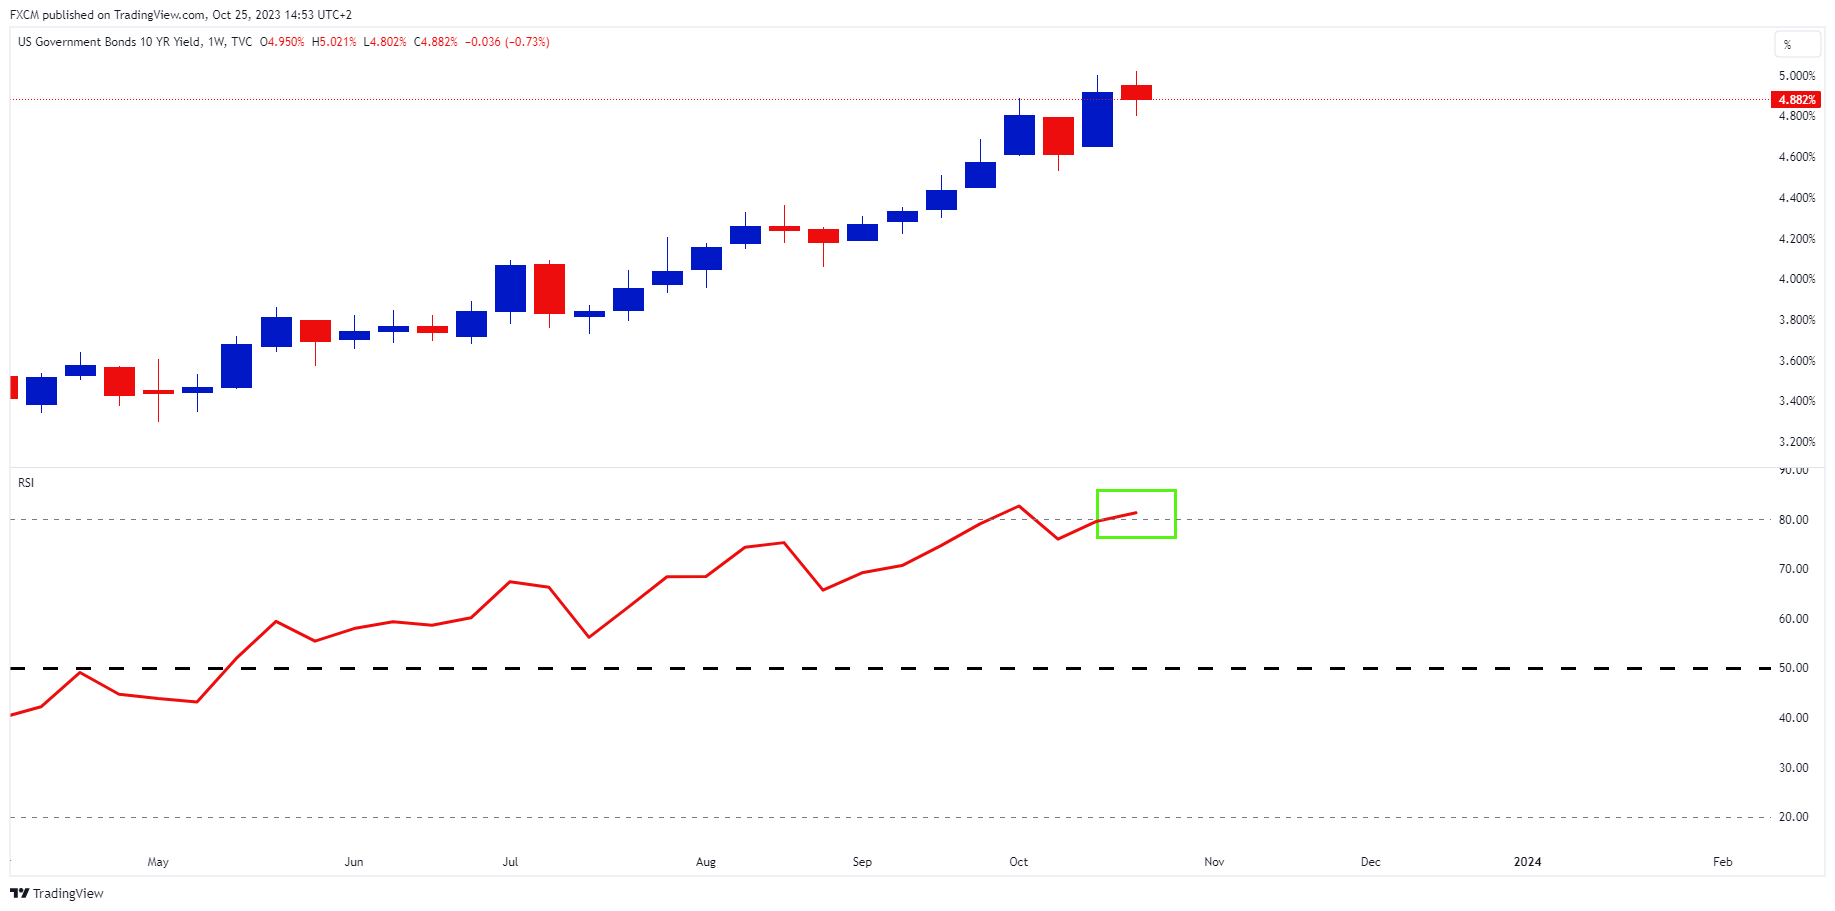
Source: www.tradingview.com
The US 10-year weekly chart shows that the RSI is above 80 (green rectangle). This is considered an overbought condition and likely places a ceiling on the yield until the overbought condition normalises. Thus, the negative divergence on the daily chart makes sense. I.e., the daily momentum is showing signs of slowing because on a broader basis there is potentially limited upside for the 10- year yield.
Bond Value
At this stage, and after a savage selloff, bonds have potential value. If they are attractive at current levels, demand will foster price increases which in turn will pressure yields. One metric that suggests value is the real US 10-year yield, which is around 2.48%. I.e., the yield is almost 2.5% above the average inflation that is expected over the next 10-years. It has not been this high since December 2008 and is certainly compelling at current levels to bond investors.
Image by Gerd Altmann from Pixabay

Russell Shor
Senior Market Specialist
Russell Shor joined FXCM in October 2017 as a Senior Market Specialist. He is a certified FMVA® and has an Honours Degree in Economics from the University of South Africa. Russell is a full member of the Society of Technical Analysts in the United Kingdom. With over 20 years of financial markets experience, his analysis is of a high standard and quality.
Any opinions, news, research, analyses, prices, other information, or links to third-party sites contained on this website are provided on an "as-is" basis, as general market commentary and do not constitute investment advice. The market commentary has not been prepared in accordance with legal requirements designed to promote the independence of investment research, and it is therefore not subject to any prohibition on dealing ahead of dissemination. Although this commentary is not produced by an independent source, FXCM takes all sufficient steps to eliminate or prevent any conflicts of interests arising out of the production and dissemination of this communication. The employees of FXCM commit to acting in the clients' best interests and represent their views without misleading, deceiving, or otherwise impairing the clients' ability to make informed investment decisions. For more information about the FXCM's internal organizational and administrative arrangements for the prevention of conflicts, please refer to the Firms' Managing Conflicts Policy. Please ensure that you read and understand our Full Disclaimer and Liability provision concerning the foregoing Information, which can be accessed here.