What is stagflation?
Introduction
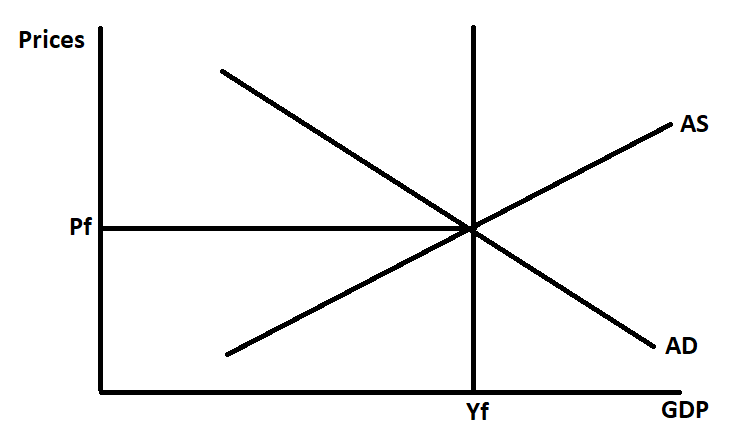
Stagflation describes an economy experiencing higher inflation pressures at the same time that growth is declining. This combination alarms policymakers because prescriptions for containing inflation intensify declining growth, hurting an already shrinking job market. At the same time, policies to promote growth in GDP tend to exacerbate the already high inflation. Initially, we consider the following macroeconomic position:
Where:
1. Prices: general prices in an economy, referring to inflation.
2. GDP: the measure of production in the economy.
3. AD: aggregate demand
4. AS: aggregate supply
5. Yf: full employment (including the natural rate of unemployment).
6. Pf: This is the general price level when the economy is in equilibrium and AD=AS=Yf.
Aggregate Supply and Supply-Side Shocks
This article explores stagflation by emphasising aggregate supply in the short-to-medium term and its response to supply-side shocks. Aggregate supply (AS) is upward sloping because over this time frame, some, but not all, costs to businesses are able to adjust. This stickiness implies that any shocks to aggregate supply tend to shift the AS curve. In this article, we will assume an exogenous supply shock.
Consider the prices of raw materials, which are used as inputs for production and are a core cost to businesses. The cheaper these are, the lower the production costs and the higher a business's gross margin. If the price of raw materials changes, companies will tend to defend their margins as much as possible. This adjustment infers that production rates adapt to any price changes of raw materials.
Raw materials include:
1. Copper.
2. Oil.
3. Wheat
4. Corn
5. Natural gas
6. etc.
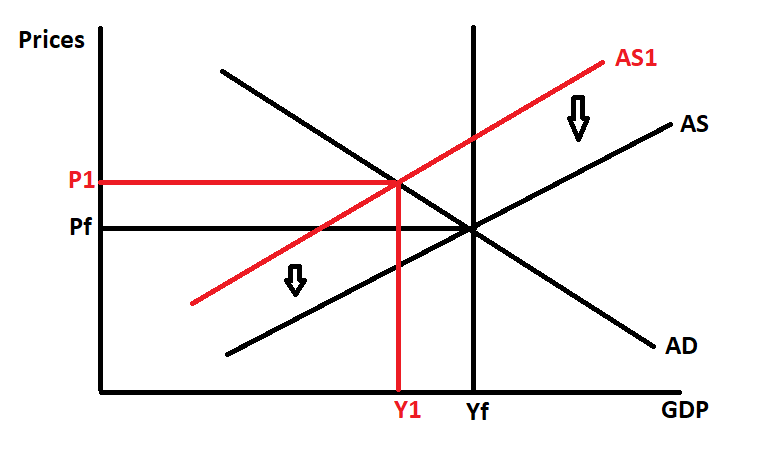
Our model will assume that an exogenous supply shock makes raw materials more expensive, which is a typical catalyst for a stagflationary environment. Consider:
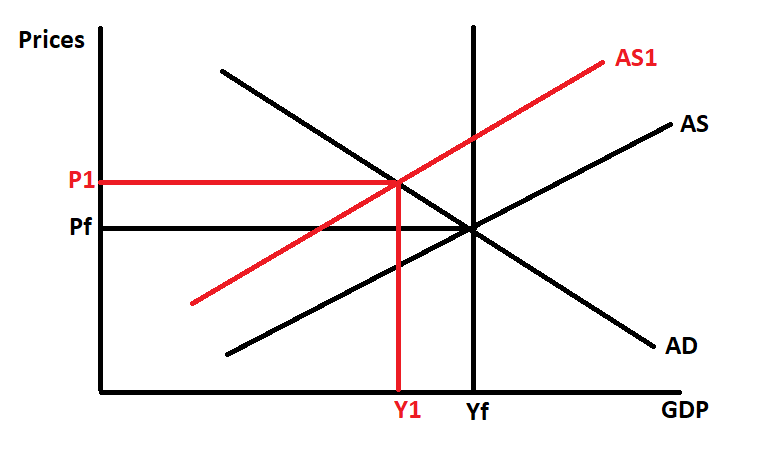
As raw materials become more expensive, producers adjust to protect their margins. This "fine-tuning" will be through a combination of increasing their prices and cutting variable costs. These adjustments on a macro scale shift aggregate supply from AS to AS1, which has dire consequences for our model that was initially at long-term equilibrium PfYf:
- Production declines from Yf to Y1, which insinuates an increase in unemployment.
- The aggregate price increases from Pf to P1, which is an inflationary effect.
The supply shock decreased production, increased unemployment, and increased prices. The new model's equilibrium is P1Y1. There are economic effects, e.g., loss of consumer surplus (welfare degradation) and deadweight losses (economic inefficiencies), but these are beyond the scope of this article. This adversity is the effects of stagflation.
Potential policy remedies
Stagflation makes a policymaker's job extremely difficult. It is a nightmare scenario because any remedy taken comes with a tradeoff. For example, let us consider a situation where the central bank lowers interest rates, and the government embarks on expansionary fiscal policy. This injection leads to an increase in aggregate demand as consumption and investment respond. Consider:
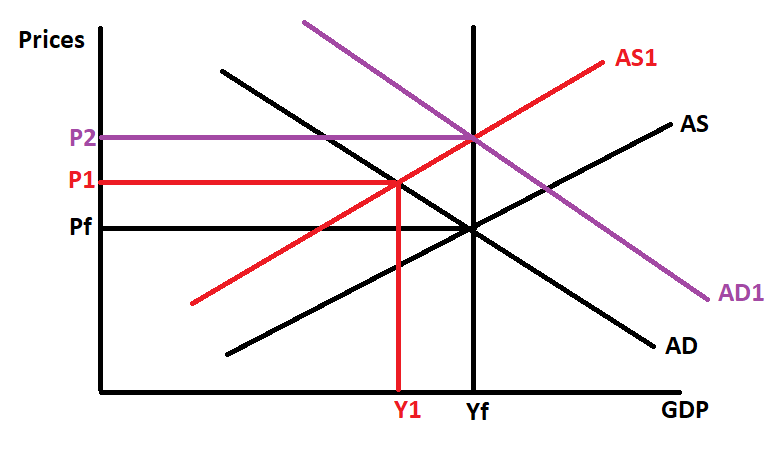
In our model, the expansion shifts aggregate demand from AD to AD1. The effects are as follows:
1. Production increases from Y1 back to Yf, which insinuates lower unemployment.
2. However, this comes at a cost as the price moves from P1 to P2.
In this scenario, the decision to pursue expansionary policies to relieve unemployment comes at an inflationary cost. The model's new equilibrium is P2Yf
Let's consider a second example where the central banks raise interest rates, and the government embarks on a contractionary fiscal policy. This economic withdrawal leads to a decrease in aggregate demand as consumption and investment respond to the tighter conditions. Consider:
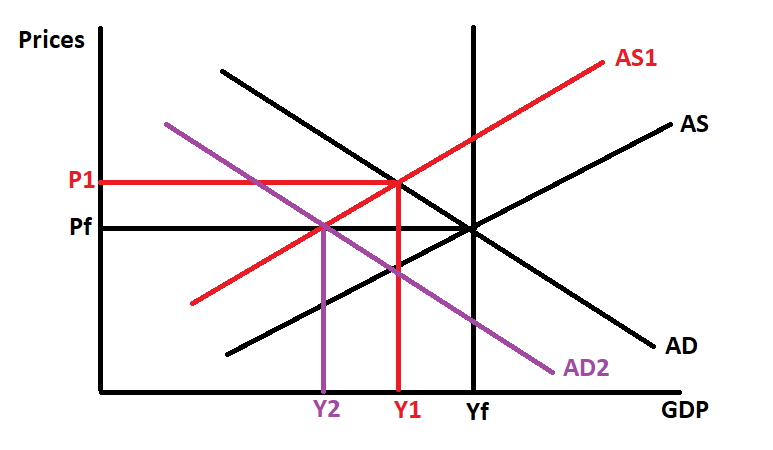
In our model, the contraction shifts aggregate demand from AD to AD2. The effects are as follows:
1. Inflation is tamed, and price moves from P1 back to Pf.
2. However, this comes with costs as production declines further from Y1 to Y2. This movement leads to even higher unemployment.
In this scenario, the decision to pursue contractionary policies to relieve high inflation comes at the price of higher unemployment and lower production. The model's new equilibrium is PfY2
Preferred Action
One potential solution is for policymakers to do nothing and wait for wages to decline due to the high unemployment. This reduction will decrease production costs, and theoretically, the aggregate supply curve will shift to the right. Consider:
In this scenario, the lower wages shift aggregate supply from AS1 back to AS. The effects are:
1. Production will slowly increase, and employment will restore to full employment; Y1 moves to Yf.
2. At the same time, inflation moderates, and price moves from P1 to Pf.
3. Ultimately, equilibrium restores at PfYf.
However, the prospect of lower wages or higher unemployment will be untenable socially. This general unhappiness may lead to the incumbents voted out of office due to dissatisfaction.
Conclusion
The '70 and early '80s experienced stagflation; unemployment and inflation were high as aggregate supply shifted left. For example, in 1973, oil prices jumped to eventually increase by 400%. Stagflation is once again a threat. Following the Russian invasion of Ukraine on 24 February 2022, supply shocks have caused oil, wheat, corn, etc., to spike at a time when inflation is already rampaging at rates not seen since the early '80s. As indicated above, it is challenging to solve. Policymakers are growing concerned, watching market developments with absolute interest. Governments may choose to incur some of the costs of the supply shock through subsidization programs, which may moderate (but not eliminate) the adverse shift in aggregate supply. However, this may result in inefficient allocation of resources and further deadweight losses.
References:
- corporatefinanceinstitute.com
- cfa program curriculum 2022 level 1 volume 2

Russell Shor
Senior Market Specialist
Russell Shor joined FXCM in October 2017 as a Senior Market Specialist. He is a certified FMVA® and has an Honours Degree in Economics from the University of South Africa. Russell is a full member of the Society of Technical Analysts in the United Kingdom. With over 20 years of financial markets experience, his analysis is of a high standard and quality.
Any opinions, news, research, analyses, prices, other information, or links to third-party sites contained on this website are provided on an "as-is" basis, as general market commentary and do not constitute investment advice. The market commentary has not been prepared in accordance with legal requirements designed to promote the independence of investment research, and it is therefore not subject to any prohibition on dealing ahead of dissemination. Although this commentary is not produced by an independent source, FXCM takes all sufficient steps to eliminate or prevent any conflicts of interests arising out of the production and dissemination of this communication. The employees of FXCM commit to acting in the clients' best interests and represent their views without misleading, deceiving, or otherwise impairing the clients' ability to make informed investment decisions. For more information about the FXCM's internal organizational and administrative arrangements for the prevention of conflicts, please refer to the Firms' Managing Conflicts Policy. Please ensure that you read and understand our Full Disclaimer and Liability provision concerning the foregoing Information, which can be accessed here.