The Fed Appears To Be Behind The Curve
Past performance is not an indicator of future results.
Source: www.tradingview.com
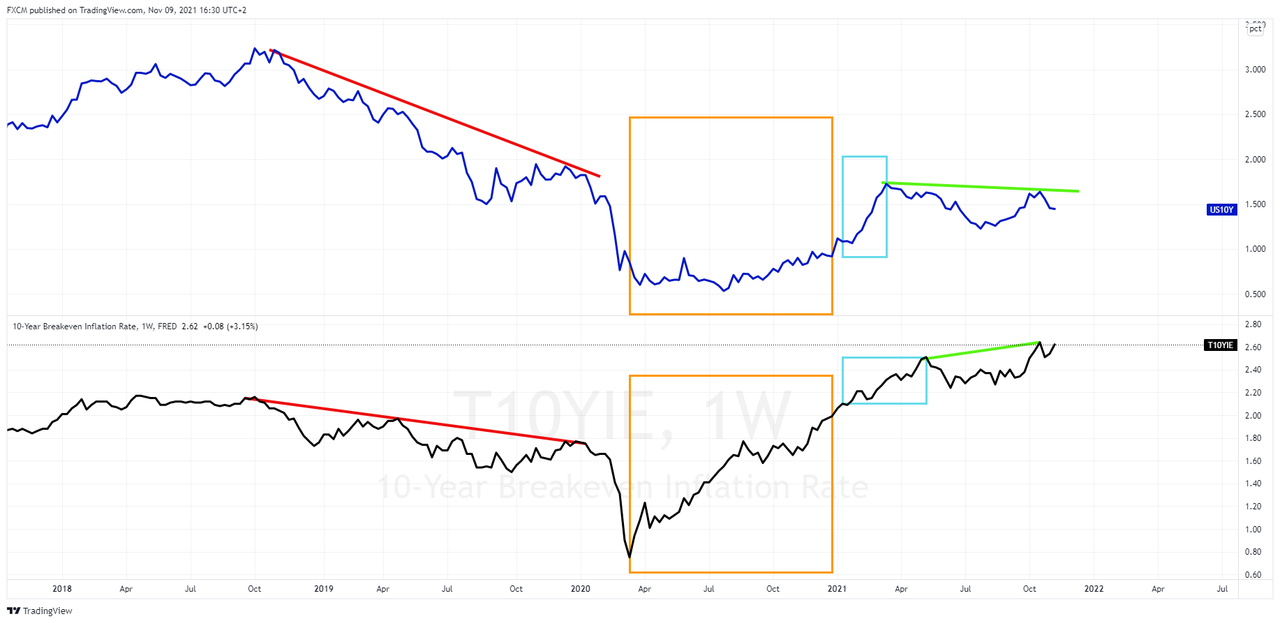
Prior to the Covid-19 pandemic, the US10Y yield (blue line chart) was in decline. At the same time, the 10Y breakeven inflation rate was coming down. This period is denoted by the red down trendlines.
The orange box represents most of the 2020 year, as authorities implemented unprecedented monetary stimulus to deal with the fallout of the pandemic. To this end, the Fed announced unlimited QE on 23 March 2020. During the orange box period, the 10 year breakeven rate was appreciating, but the US10Y note failed to respond. This was due to the central bank taking an active role in control the 10Y yield.
However, as the market recognised the low base effect, high oil prices, and general demand pull inflation factors, the US10Y played catch up and followed the breakeven rate higher (aqua box period). Of importance, the current breakeven yield is higher than its pre-covid level, whilst the US10Y lags in this regard. This phenomenon is seen along the yield curve.
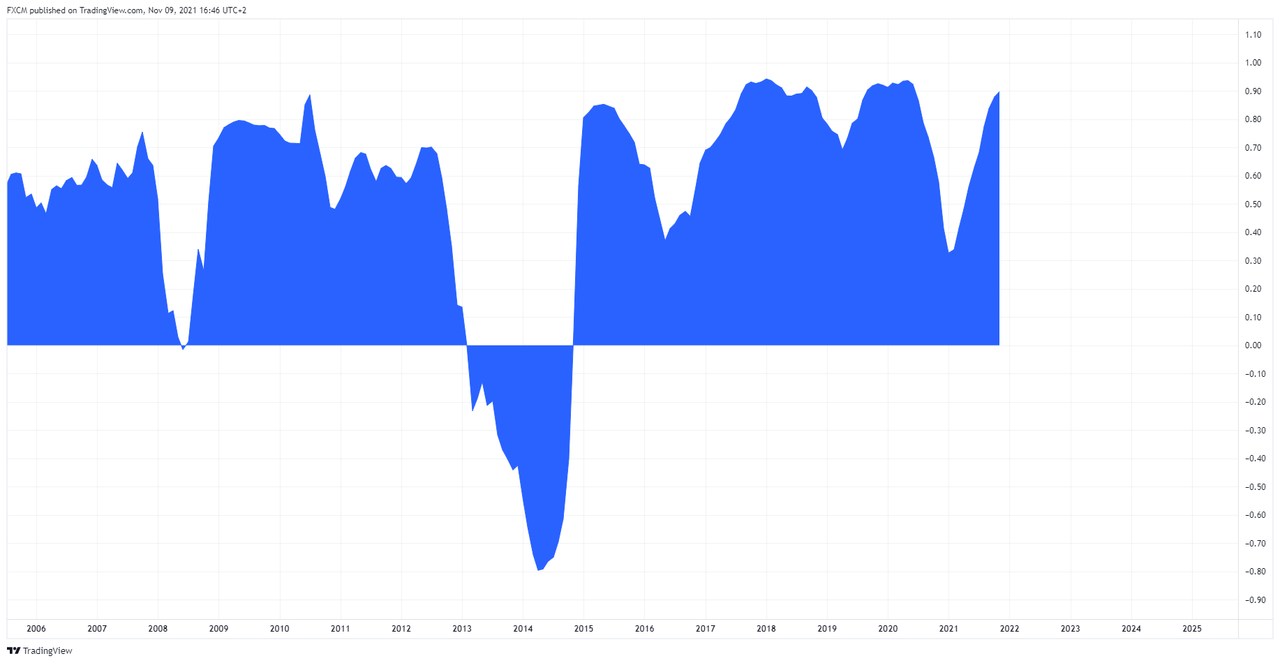
Moreover, there is a divergence in the trajectories of the US10Y and the breakeven (green trendlines) for 2021. This is because the Fed has on a consistent basis, since April pushed back on the idea of near-term rate hikes, and is still active in the bond market. However, consider the long-term correlation between the 10Y breakeven rate and US10Y treasury note:
Past performance is not an indicator of future results.
Source: www.tradingview.com
The current correlation on a long-term monhly basis is 0.9. This is an extremely strong reading and has, except for a brief period, been positive. This is not surprising given the economic relationship between interest rates and inflation. Today, wholesale prices, as per the PPI, are up 8.6% y-o-y, the highest in 11 years, and 6.2% on a core basis. Tomorrow we get the CPI readings, another piece of the puzzle.
Further references: cnbc.com

Russell Shor
Senior Market Specialist
Russell Shor joined FXCM in October 2017 as a Senior Market Specialist. He is a certified FMVA® and has an Honours Degree in Economics from the University of South Africa. Russell is a full member of the Society of Technical Analysts in the United Kingdom. With over 20 years of financial markets experience, his analysis is of a high standard and quality.
Any opinions, news, research, analyses, prices, other information, or links to third-party sites contained on this website are provided on an "as-is" basis, as general market commentary and do not constitute investment advice. The market commentary has not been prepared in accordance with legal requirements designed to promote the independence of investment research, and it is therefore not subject to any prohibition on dealing ahead of dissemination. Although this commentary is not produced by an independent source, FXCM takes all sufficient steps to eliminate or prevent any conflicts of interests arising out of the production and dissemination of this communication. The employees of FXCM commit to acting in the clients' best interests and represent their views without misleading, deceiving, or otherwise impairing the clients' ability to make informed investment decisions. For more information about the FXCM's internal organizational and administrative arrangements for the prevention of conflicts, please refer to the Firms' Managing Conflicts Policy. Please ensure that you read and understand our Full Disclaimer and Liability provision concerning the foregoing Information, which can be accessed here.