McDonald’s Adopts Fastest Growth in its History

Weekly Chart Analysis
Source: www.tradingview.com
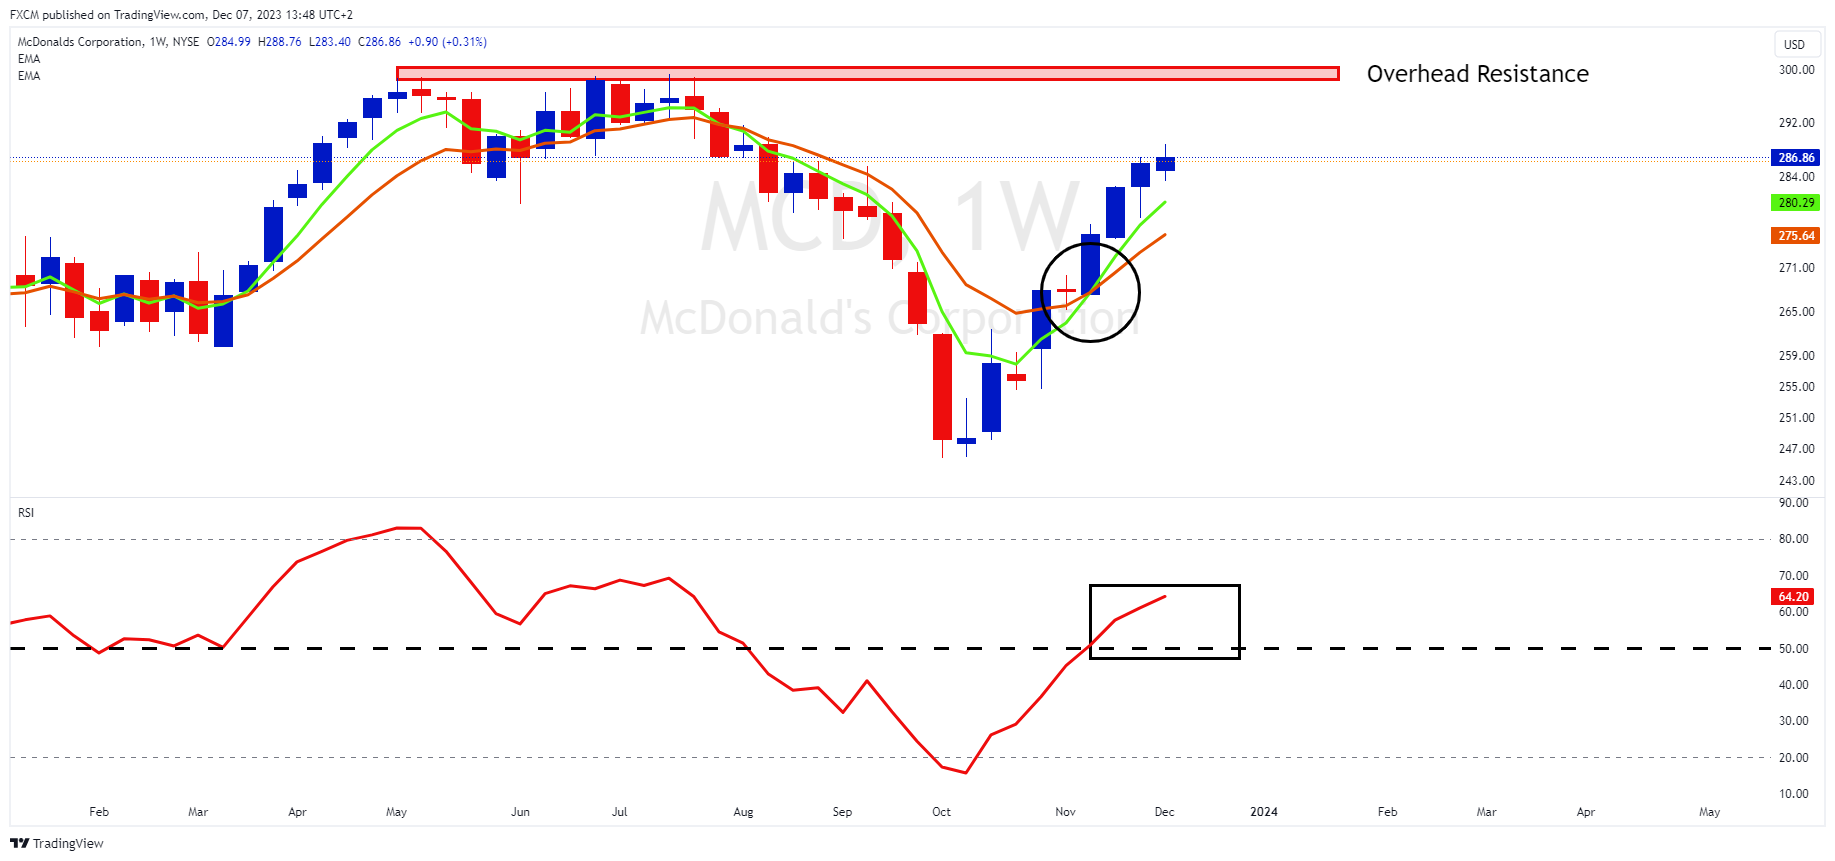
The McDonald's (MCD.us) weekly chart has bullish signs to it. It's green 5-week EMA has crossed above its orange 10-week EMA (black circle). This puts the EMAs into a bullish formation. Moreover, its RSI has popped above 50 (black rectangle). This is the bullish side of the indicator and the longer it maintains above 50 the greater the momentum support for the share price.
There is price resistance overhead around the $300 mark (red shaded horizontal), which may hold up price. However, if the RSI can sustain on the bullish side of 50, the share price will likely try at a breakout.
Comment
At its investor event yesterday, McDonald's said that it is planning to open 10,000 new restaurants by 2027. This will bring the number of stores to 50,000 - it currently has more than 40,000 restaurants as per its latest quarterly filing.
The company is also betting that it will have 250 million active users in its loyalty program within the next four years. The current number is 150 million users with My McDonald's Rewards recording $20 billion in revenue for 2023.
Additional efforts involve expanding delivery services, enhancing drive-through and mobile-order operations, and refining the essential items on the menu. Guidance for next year sees approximately 2% growth in systemwide sales and over 4% in new restaurant expansion. Operating margin is projected to be in the mid-to-high 40% range, with capital spending reaching around $2.5 billion.
Looking to 2027, annual systemwide sales are expected to increase by about 2.5%, with new restaurant growth at 4% to 5% per annum. Spending will rise by $300 million to $500 million each year through 2027.

Russell Shor
Senior Market Specialist
Russell Shor joined FXCM in October 2017 as a Senior Market Specialist. He is a certified FMVA® and has an Honours Degree in Economics from the University of South Africa. Russell is a full member of the Society of Technical Analysts in the United Kingdom. With over 20 years of financial markets experience, his analysis is of a high standard and quality.
Any opinions, news, research, analyses, prices, other information, or links to third-party sites contained on this website are provided on an "as-is" basis, as general market commentary and do not constitute investment advice. The market commentary has not been prepared in accordance with legal requirements designed to promote the independence of investment research, and it is therefore not subject to any prohibition on dealing ahead of dissemination. Although this commentary is not produced by an independent source, FXCM takes all sufficient steps to eliminate or prevent any conflicts of interests arising out of the production and dissemination of this communication. The employees of FXCM commit to acting in the clients' best interests and represent their views without misleading, deceiving, or otherwise impairing the clients' ability to make informed investment decisions. For more information about the FXCM's internal organizational and administrative arrangements for the prevention of conflicts, please refer to the Firms' Managing Conflicts Policy. Please ensure that you read and understand our Full Disclaimer and Liability provision concerning the foregoing Information, which can be accessed here.