Core PCE’s Moderation Accelerated, Which Is a Good Sign for Yields

Introduction
The Federal Reserve's preferred inflation gauge is showing signs of moderation. Core PCE came in at 3.9% y/y, which was lower than last month's 4.3% y/y. On a monthly basis, core PCE printed at 0.1% m/m, which was lower than the 0.2% m/m expected. This shows that the Fed's efforts are yielding results, because the monthly number annualises to 1.2%, which is lower than the central bank's target of 2%.
Core PCE Line Chart
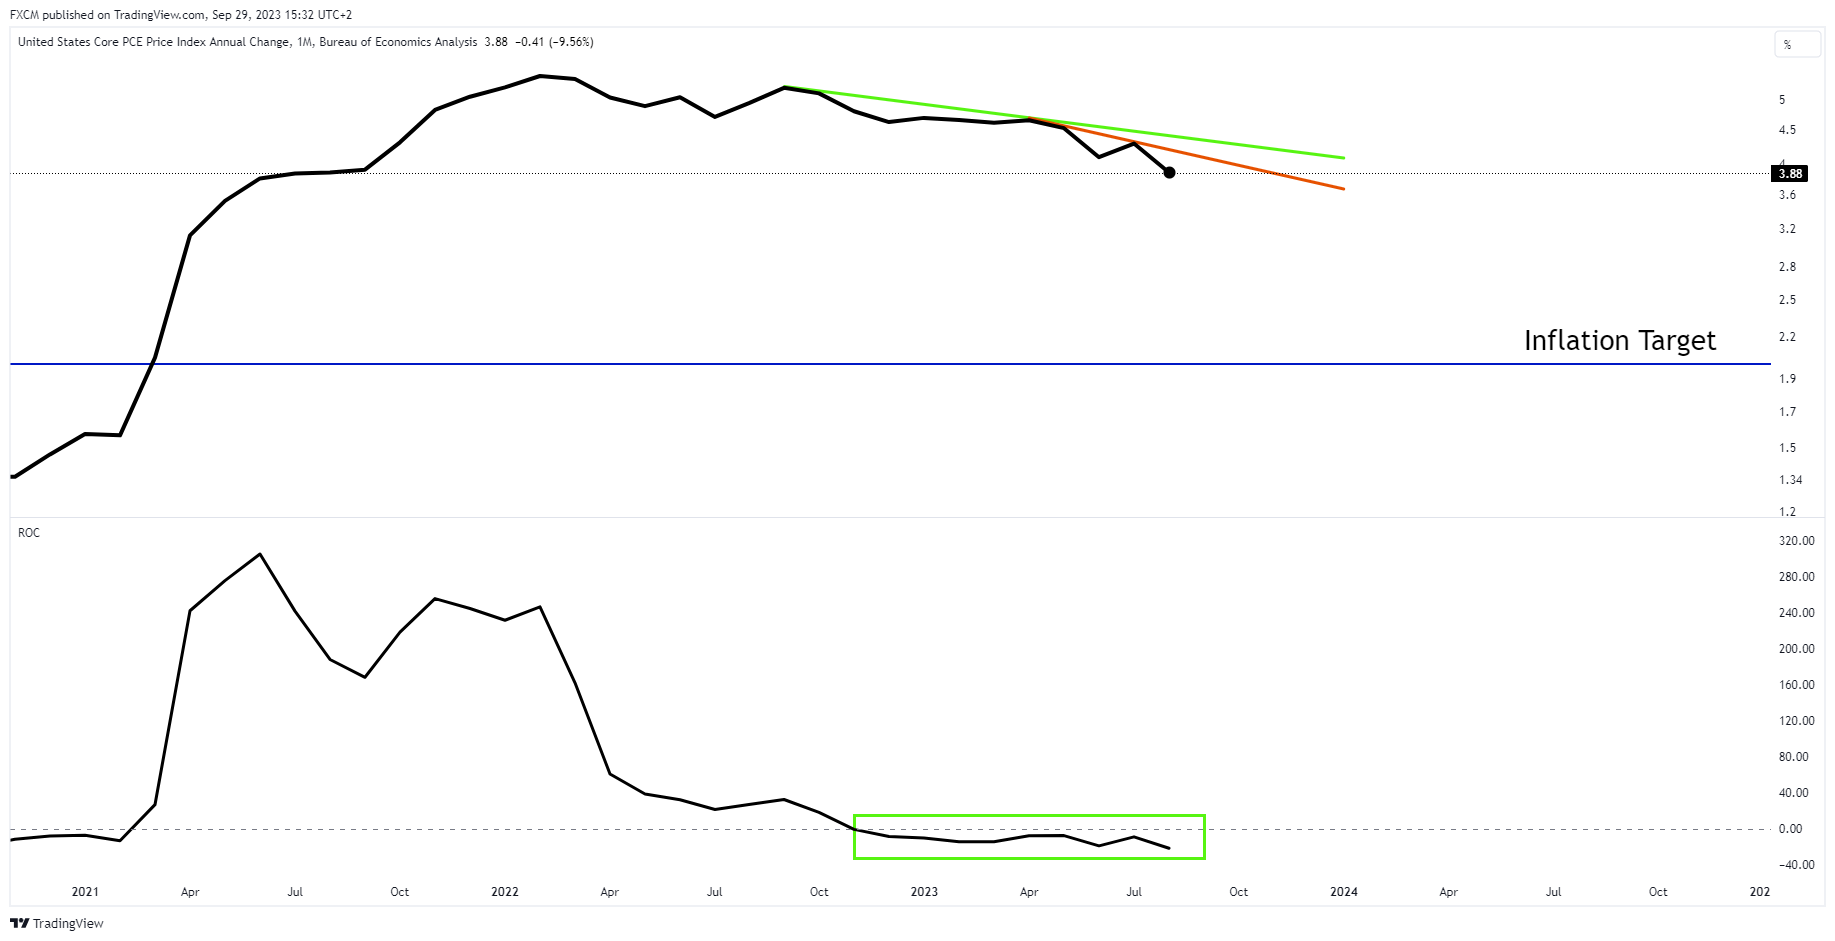
Source:www.tradingview.com
The core PCE line chart shows that the downtrend in the series has accelerated. I.e., the trendline's gradient has steepened from the green trendline to the orange trendline. Moreover, the core PCE's rate of change remains on the deceleration side of zero (green rectangle). This connotes that the series is heading in the right direction towards the Fed's target.
High Yields and Oil Prices
If the PCE continues to moderate, there may be a change in narrative when it comes to yields being "higher for longer," which are pressuring risk markets and pushing the USDOLLAR higher.
However, there is a complexity here. Headline inflation is less encouraging. This is mainly due to the higher oil prices that are benefiting from the supply cuts from OPEC+ and are edging towards $100 per barrel. This will make controlling inflation more difficult and will be monitored by the Federal Reserve.

Russell Shor
Senior Market Specialist
Russell Shor joined FXCM in October 2017 as a Senior Market Specialist. He is a certified FMVA® and has an Honours Degree in Economics from the University of South Africa. Russell is a full member of the Society of Technical Analysts in the United Kingdom. With over 20 years of financial markets experience, his analysis is of a high standard and quality.
Any opinions, news, research, analyses, prices, other information, or links to third-party sites contained on this website are provided on an "as-is" basis, as general market commentary and do not constitute investment advice. The market commentary has not been prepared in accordance with legal requirements designed to promote the independence of investment research, and it is therefore not subject to any prohibition on dealing ahead of dissemination. Although this commentary is not produced by an independent source, FXCM takes all sufficient steps to eliminate or prevent any conflicts of interests arising out of the production and dissemination of this communication. The employees of FXCM commit to acting in the clients' best interests and represent their views without misleading, deceiving, or otherwise impairing the clients' ability to make informed investment decisions. For more information about the FXCM's internal organizational and administrative arrangements for the prevention of conflicts, please refer to the Firms' Managing Conflicts Policy. Please ensure that you read and understand our Full Disclaimer and Liability provision concerning the foregoing Information, which can be accessed here.