Yields Are Dominating and Creating a Risk-Off Environment

The US 10-year Treasury yield is trading at 4.97%, just shy of the psychological 5% level. This is likely to weigh on the stock market. In effect, the higher interest rates mean that yields on risk-free treasuries have increased making them compelling to investors. Even those sitting in cash will feel the benefit of the higher yields. Moreover, with these type of returns from yielding assets, it will discourage investing in riskier assets like stocks.
Another influence of the higher yields is that it negatively impacts on the present value (PV) of assets as per the time value of money. I.e., yields are inversely related to the present value and the higher yield will pressure the PV.
Consider chart 1: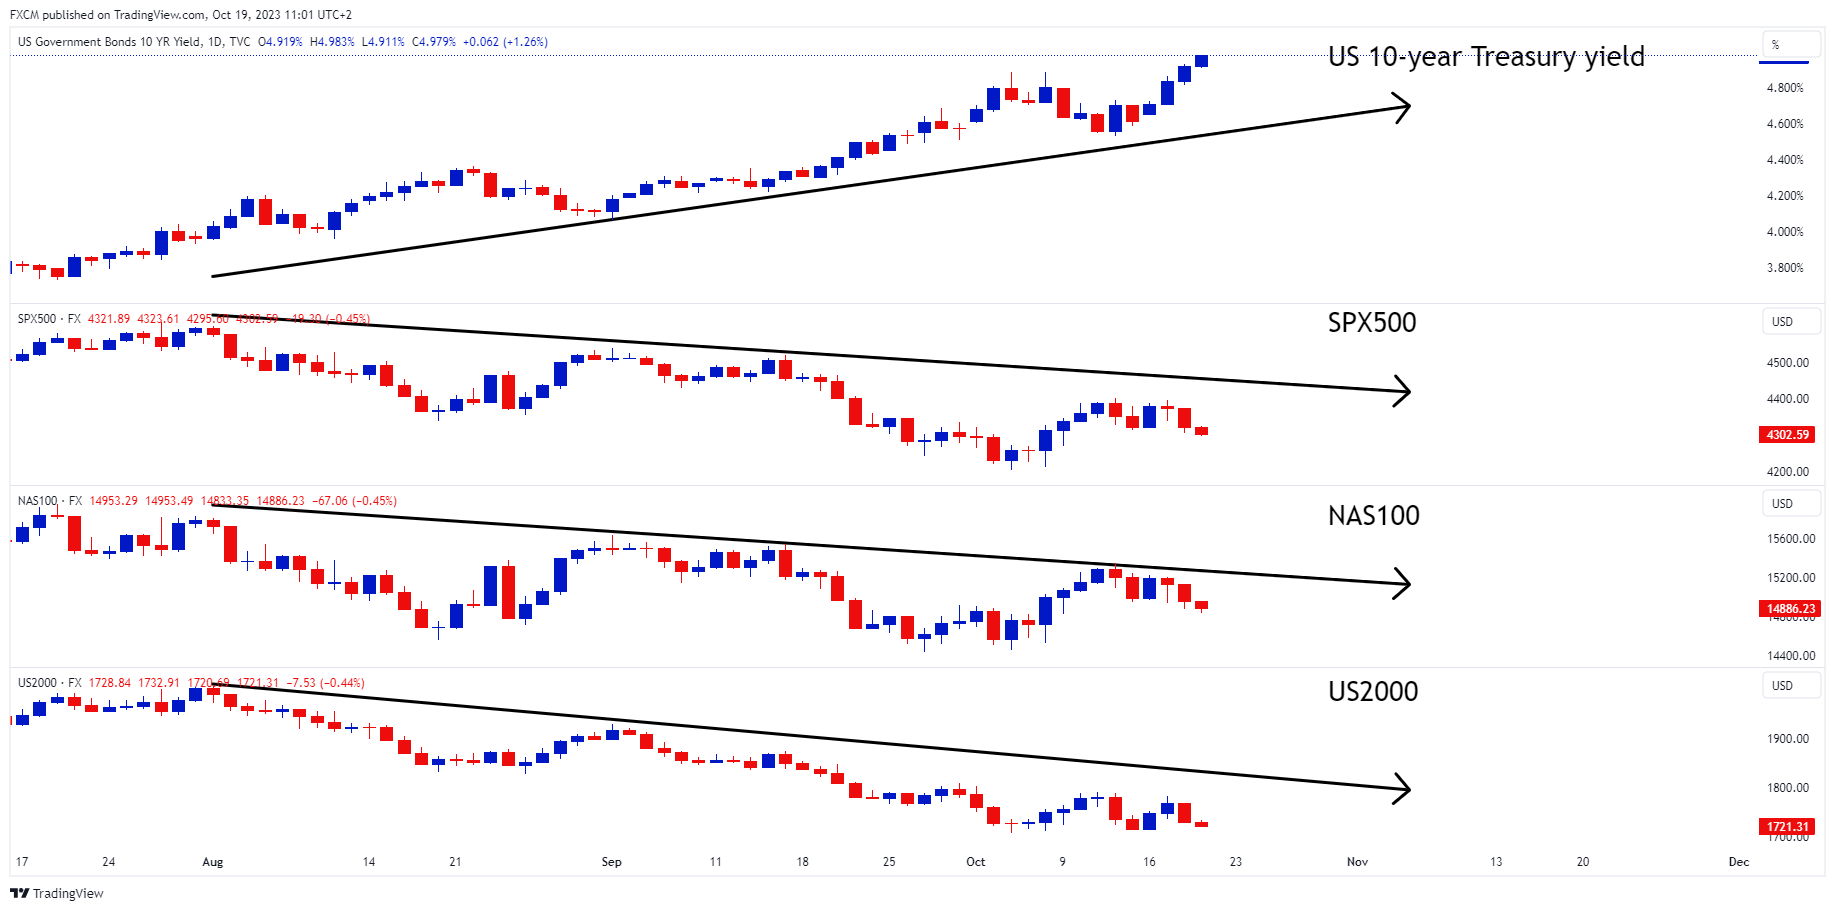
Chart 1
Source: www.tradingview.com
Chart 1 shows the 10-year Treasury yield in the top pane, with the SPX500, NAS100, and US2000 underneath. As the Treasury yield moved up and in a north-easterly direction, the respective stock indexes moved down and in a south easterly direction. The higher yield is a clear headwind for the stock indexes, particularly the US2000, which is a small companies index, and is most sensitive to the higher rates.
We are also in Q3 earnings season which will play a role here. We may be in an environment where companies are finding it hard to keep up. The Fed's Beige Book states that "Sales prices increased at a slower rate than input prices, as businesses struggled to pass along cost pressures because consumers had grown more sensitive to prices. As a result, firms struggled to maintain desired profit margins."
This combined with the headwind of higher yields may tilt the markets towards risk-off.

Russell Shor
Senior Market Specialist
Russell Shor joined FXCM in October 2017 as a Senior Market Specialist. He is a certified FMVA® and has an Honours Degree in Economics from the University of South Africa. Russell is a full member of the Society of Technical Analysts in the United Kingdom. With over 20 years of financial markets experience, his analysis is of a high standard and quality.
Any opinions, news, research, analyses, prices, other information, or links to third-party sites contained on this website are provided on an "as-is" basis, as general market commentary and do not constitute investment advice. The market commentary has not been prepared in accordance with legal requirements designed to promote the independence of investment research, and it is therefore not subject to any prohibition on dealing ahead of dissemination. Although this commentary is not produced by an independent source, FXCM takes all sufficient steps to eliminate or prevent any conflicts of interests arising out of the production and dissemination of this communication. The employees of FXCM commit to acting in the clients' best interests and represent their views without misleading, deceiving, or otherwise impairing the clients' ability to make informed investment decisions. For more information about the FXCM's internal organizational and administrative arrangements for the prevention of conflicts, please refer to the Firms' Managing Conflicts Policy. Please ensure that you read and understand our Full Disclaimer and Liability provision concerning the foregoing Information, which can be accessed here.