XAUUSD set for volatility expansion

Source: www.tradingview.com
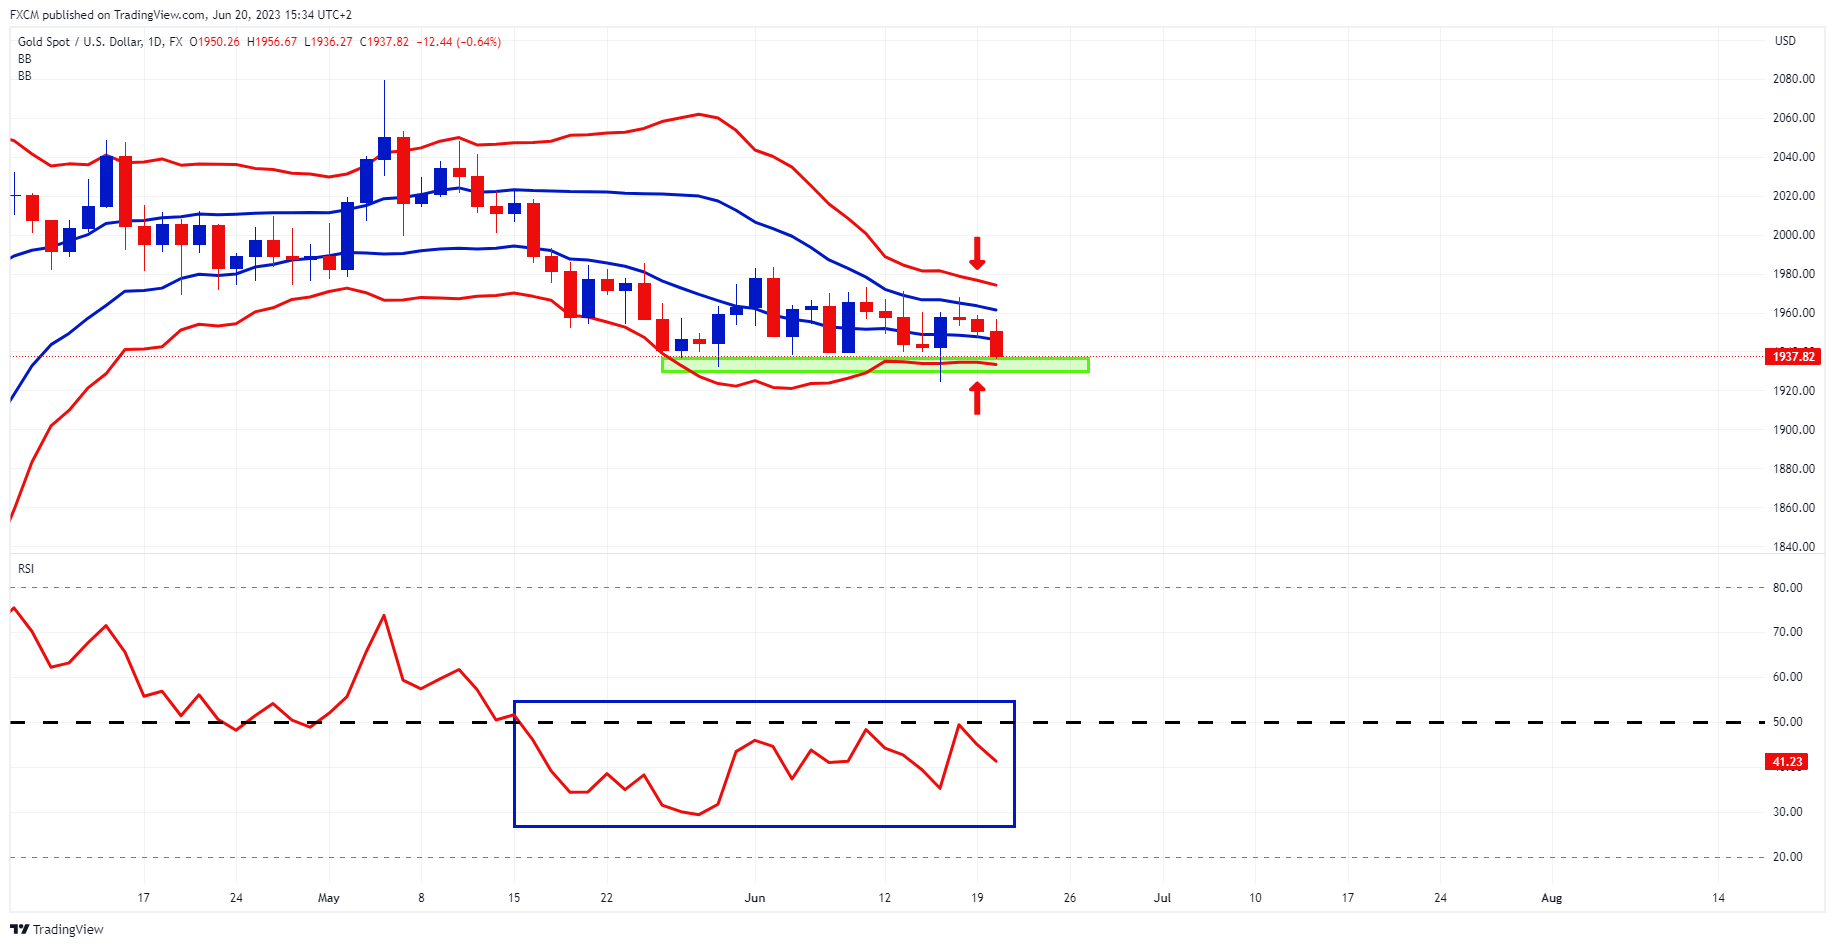
Gold has dipped and is testing its underlying support around the $1,940 area (green shaded horizontal). Moreover, the precious metal is pushing into its bearish channel, between the lower blue and red bands. Its RSI, which is a momentum oscillator, is on the bearish side of 50 (blue rectangle).
The Bollinger bands are also tightening (red arrows). This is noteworthy as Bollinger band theory suggests that volatility tends to cycle. Tight bands with low volatility lead into wide bands with expanded volatility. I.e., it seems as if an expansion in the precious metal's volatility is to be expected.
The longer XAUUSD stays in its bearish channel and the RSI remains on the softer side of 50, the greater the likelihood that the underlying support will fail as volatility expands. However, a move into the bullish zone, between the upper blue and red bands, and the RSI popping above 50 will suggest the expansion in volatility has an upside bias.
A driver here might be Fed Chair Powell's testimony on Wednesday to the House Financial Services Committee and Thursday to the Senate Banking Committee. The more hawkish the testimonies, the more pressure is likely to be applied to the precious metal.

Russell Shor
Senior Market Specialist
Russell Shor joined FXCM in October 2017 as a Senior Market Specialist. He is a certified FMVA® and has an Honours Degree in Economics from the University of South Africa. Russell is a full member of the Society of Technical Analysts in the United Kingdom. With over 20 years of financial markets experience, his analysis is of a high standard and quality.
Any opinions, news, research, analyses, prices, other information, or links to third-party sites contained on this website are provided on an "as-is" basis, as general market commentary and do not constitute investment advice. The market commentary has not been prepared in accordance with legal requirements designed to promote the independence of investment research, and it is therefore not subject to any prohibition on dealing ahead of dissemination. Although this commentary is not produced by an independent source, FXCM takes all sufficient steps to eliminate or prevent any conflicts of interests arising out of the production and dissemination of this communication. The employees of FXCM commit to acting in the clients' best interests and represent their views without misleading, deceiving, or otherwise impairing the clients' ability to make informed investment decisions. For more information about the FXCM's internal organizational and administrative arrangements for the prevention of conflicts, please refer to the Firms' Managing Conflicts Policy. Please ensure that you read and understand our Full Disclaimer and Liability provision concerning the foregoing Information, which can be accessed here.