Weakness Seeps Into The NAS100

Weekly Analysis
Source: www.tradingview.com
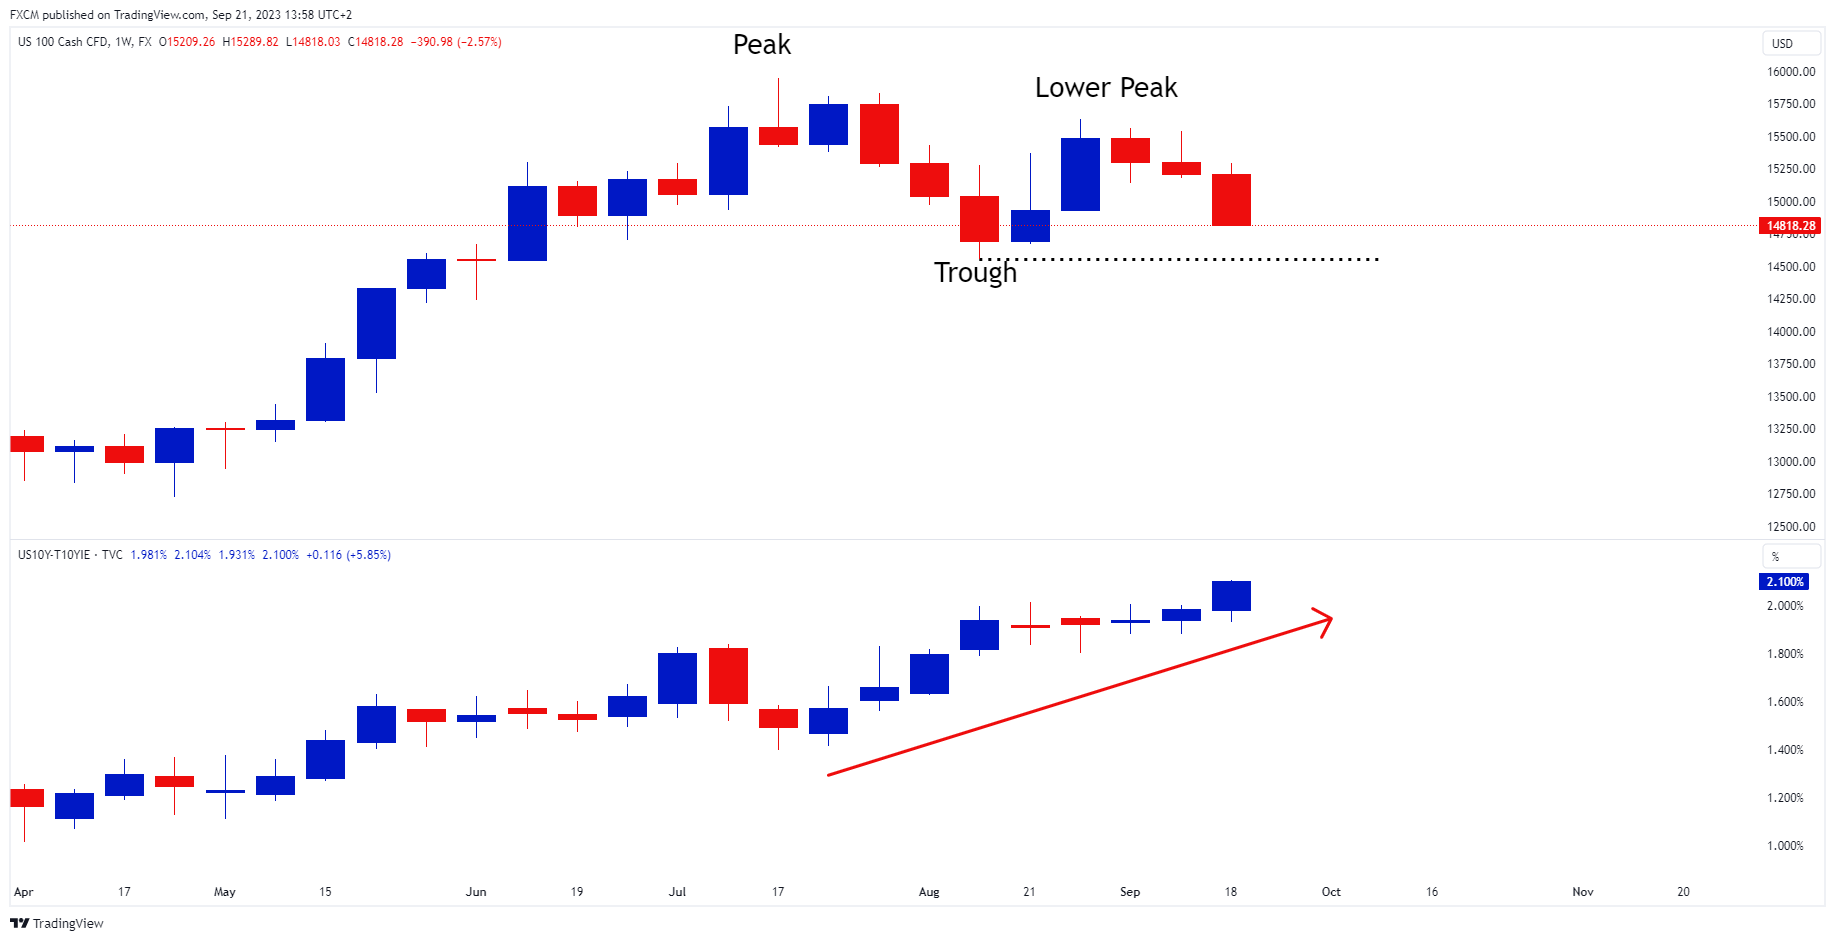
Weakness is starting to seep into the NAS100 (top chart), with the index charting a lower peak. If it drops below 14,555.70 (black dotted horizontal) it will chart a lower trough, which will put the index into downtrend on the weekly timeframe. The pressure being applied to the NAS100 comes from the appreciation in the US 10-year real rate (bottom chart), which has accelerated upwards since the last week of July (red arrow) and is now yielding 2.10%.
This weakness is not surprising given the NAS100's time value of money characteristics. I.e., the NAS100 is a growth index, and the growth side of the market is particularly sensitive to interest rates. Last night the Fed left rates unchanged but the dot-plot pointed towards a "higher for longer" theme. This has pulled the real yield higher and put a pressure on the NAS100.
Daily Analysis
Source: www.tradingview.com
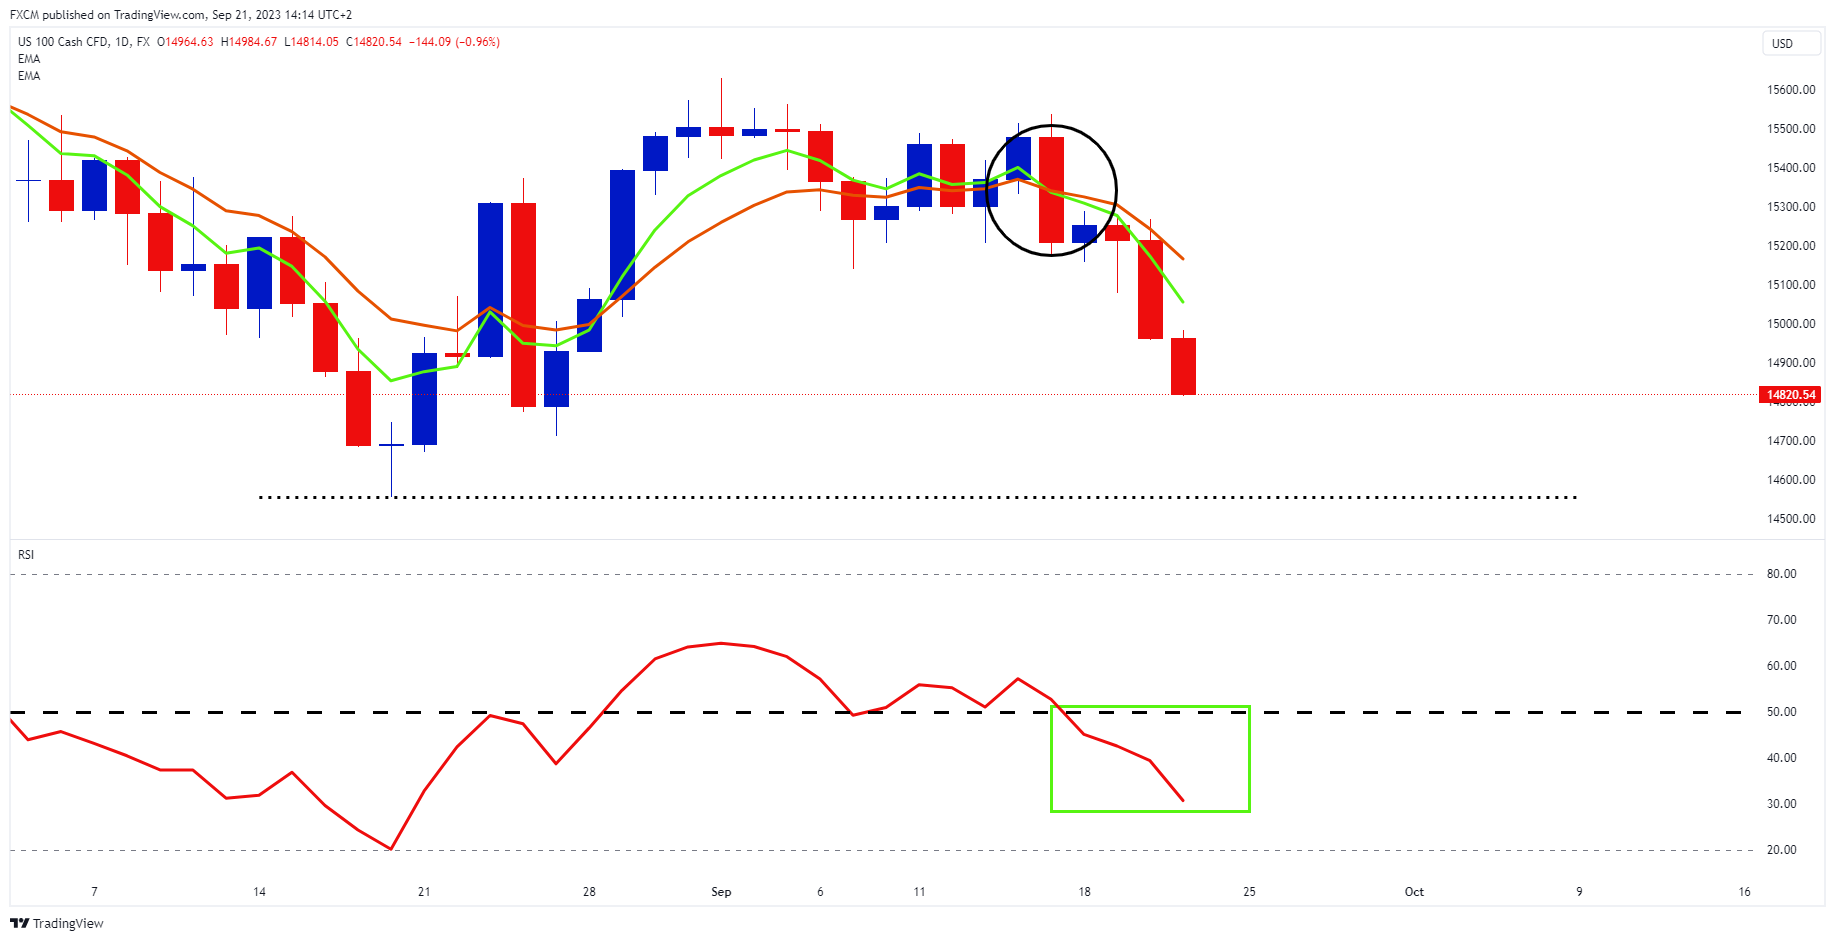
We can use the daily chart to monitor NAS100's progress towards 14,555.70 and a weekly downtrend.
Currently, the daily trend-following indicators and momentum are negative. The NAS100's green 5-day EMA is below its orange 10-day EMA, which is a bearish formation. Moreover, the daily RSI is below 50, which is on the bearish side of the indicator. The longer the RSI remains below 50, the greater the likelihood that the growth index will drop towards 14,555.70 and a downtrend.

Russell Shor
Senior Market Specialist
Russell Shor joined FXCM in October 2017 as a Senior Market Specialist. He is a certified FMVA® and has an Honours Degree in Economics from the University of South Africa. Russell is a full member of the Society of Technical Analysts in the United Kingdom. With over 20 years of financial markets experience, his analysis is of a high standard and quality.
Any opinions, news, research, analyses, prices, other information, or links to third-party sites contained on this website are provided on an "as-is" basis, as general market commentary and do not constitute investment advice. The market commentary has not been prepared in accordance with legal requirements designed to promote the independence of investment research, and it is therefore not subject to any prohibition on dealing ahead of dissemination. Although this commentary is not produced by an independent source, FXCM takes all sufficient steps to eliminate or prevent any conflicts of interests arising out of the production and dissemination of this communication. The employees of FXCM commit to acting in the clients' best interests and represent their views without misleading, deceiving, or otherwise impairing the clients' ability to make informed investment decisions. For more information about the FXCM's internal organizational and administrative arrangements for the prevention of conflicts, please refer to the Firms' Managing Conflicts Policy. Please ensure that you read and understand our Full Disclaimer and Liability provision concerning the foregoing Information, which can be accessed here.