USOIL in the Doldrums Despite Sizable OPEC+ Cuts

USOIL Analysis
Saudi Arabia, Russia and other OPEC+ members announced extra supply cuts last week, to the tune of 2.2 million barrels/day for the first quarter of the next year. These will be an addition to the preexisting output curbs of 3.33 million barrels/day, which are to continue for the entire 2024.
However, markets reacted negatively to the announcement, likely thinking that this may be the group's last card and due to broader skepticism around compliance. Moreover, demand growth is set to slow next year according the latest report by the International Energy Agency (IEA), while non-OPEC countries are projected to drive global supply growth. [1]
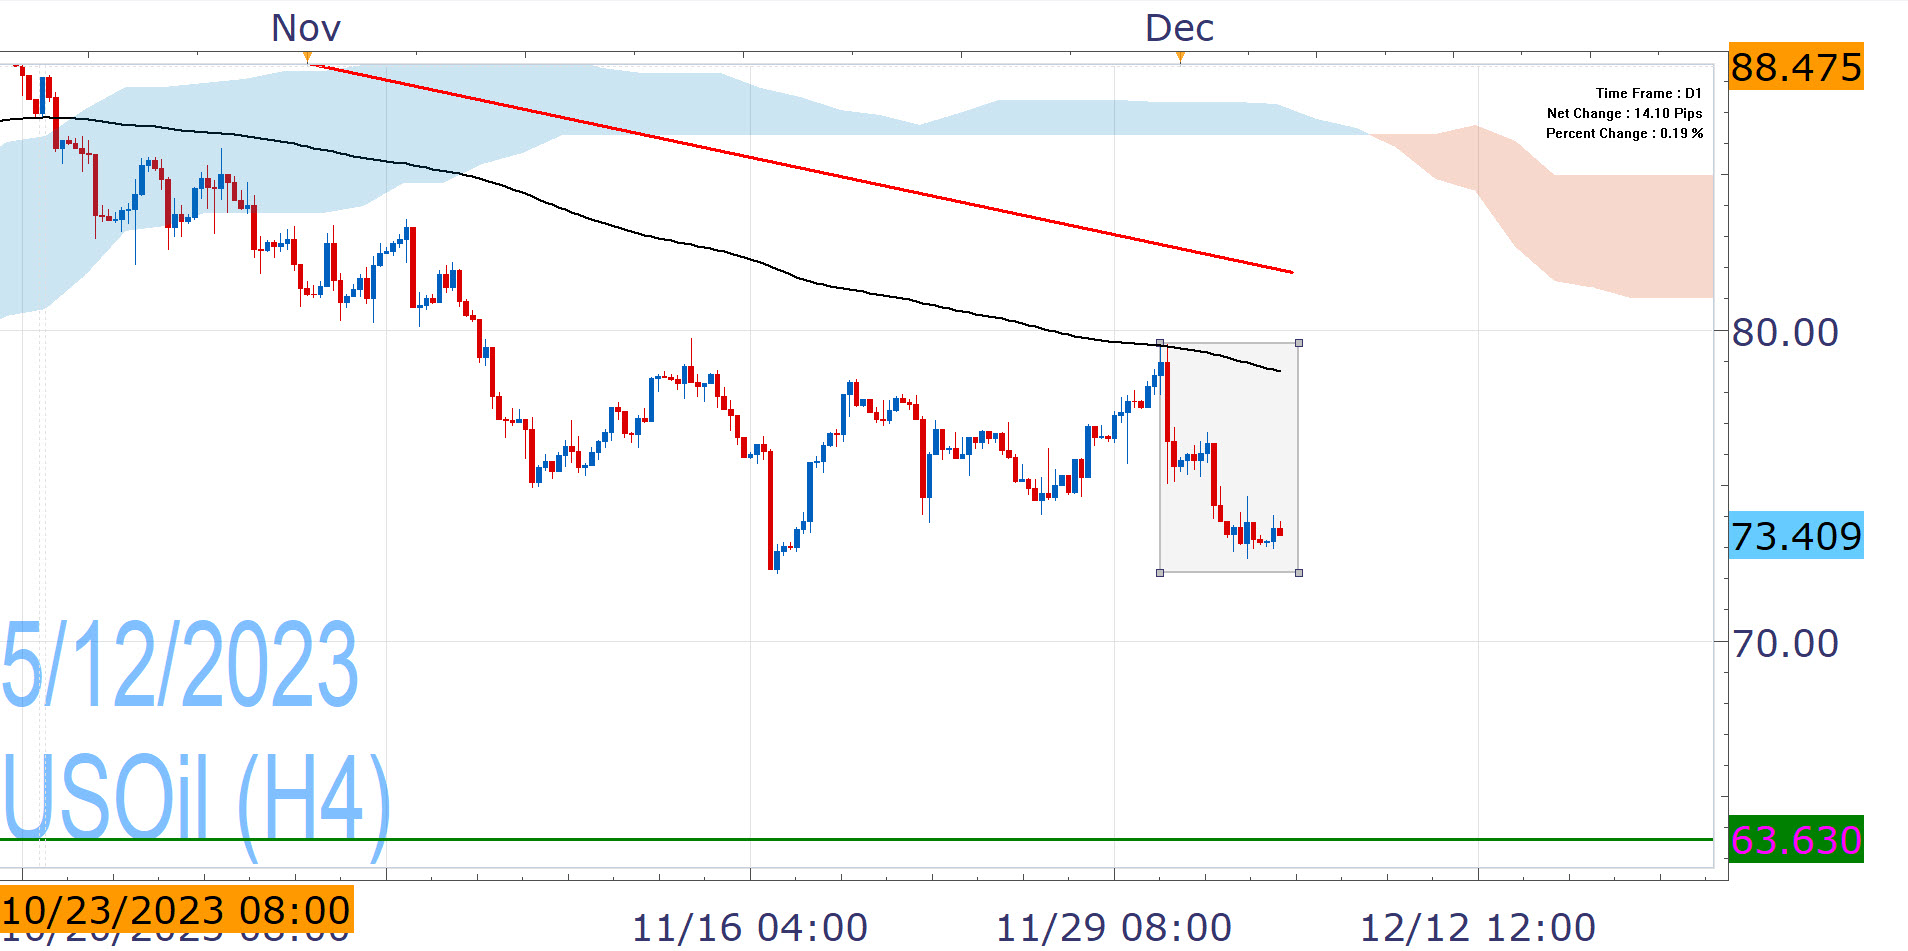
USOil enters the seventh straight losing week, its worst streak in five years. It is in a perilous state and in risk of sub-70.00 moves, although the 2023 lows (63.63) appear distant.
On the other, the OPEC+ reduction plan is rather sizable and could prevent the shift to a surplus at the start of 2024 that the IEA had warned about. Meanwhile, hopes for rate cuts by major central banks and the continuation of the Hamas-Israel war can provide support. USOil tries to talk a breath today and we could see a rebound, but meaningful recovery above the EMA200 (at around 78.70) looks hard and the upside remains hostile.

Nikos Tzabouras
Senior Financial Editorial Writer
Nikos Tzabouras is a graduate of the Department of International & European Economic Studies at the Athens University of Economics and Business. He has a long time presence at FXCM, as he joined the company in 2011. He has served from multiple positions, but specializes in financial market analysis and commentary.
With his educational background in international relations, he emphasizes not only on Technical Analysis but also in Fundamental Analysis and Geopolitics – which have been having increasing impact on financial markets. He has longtime experience in market analysis and as a host of educational trading courses via online and in-person sessions and conferences.
References
| Retrieved 07 May 2024 https://www.iea.org/reports/oil-market-report-november-2023 |
Any opinions, news, research, analyses, prices, other information, or links to third-party sites contained on this website are provided on an "as-is" basis, as general market commentary and do not constitute investment advice. The market commentary has not been prepared in accordance with legal requirements designed to promote the independence of investment research, and it is therefore not subject to any prohibition on dealing ahead of dissemination. Although this commentary is not produced by an independent source, FXCM takes all sufficient steps to eliminate or prevent any conflicts of interests arising out of the production and dissemination of this communication. The employees of FXCM commit to acting in the clients' best interests and represent their views without misleading, deceiving, or otherwise impairing the clients' ability to make informed investment decisions. For more information about the FXCM's internal organizational and administrative arrangements for the prevention of conflicts, please refer to the Firms' Managing Conflicts Policy. Please ensure that you read and understand our Full Disclaimer and Liability provision concerning the foregoing Information, which can be accessed here.