USDOLLAR is overbought and may have a price ceiling in the near-term

US 10-Year Real Yield and FXCM's USDOLLAR Basket
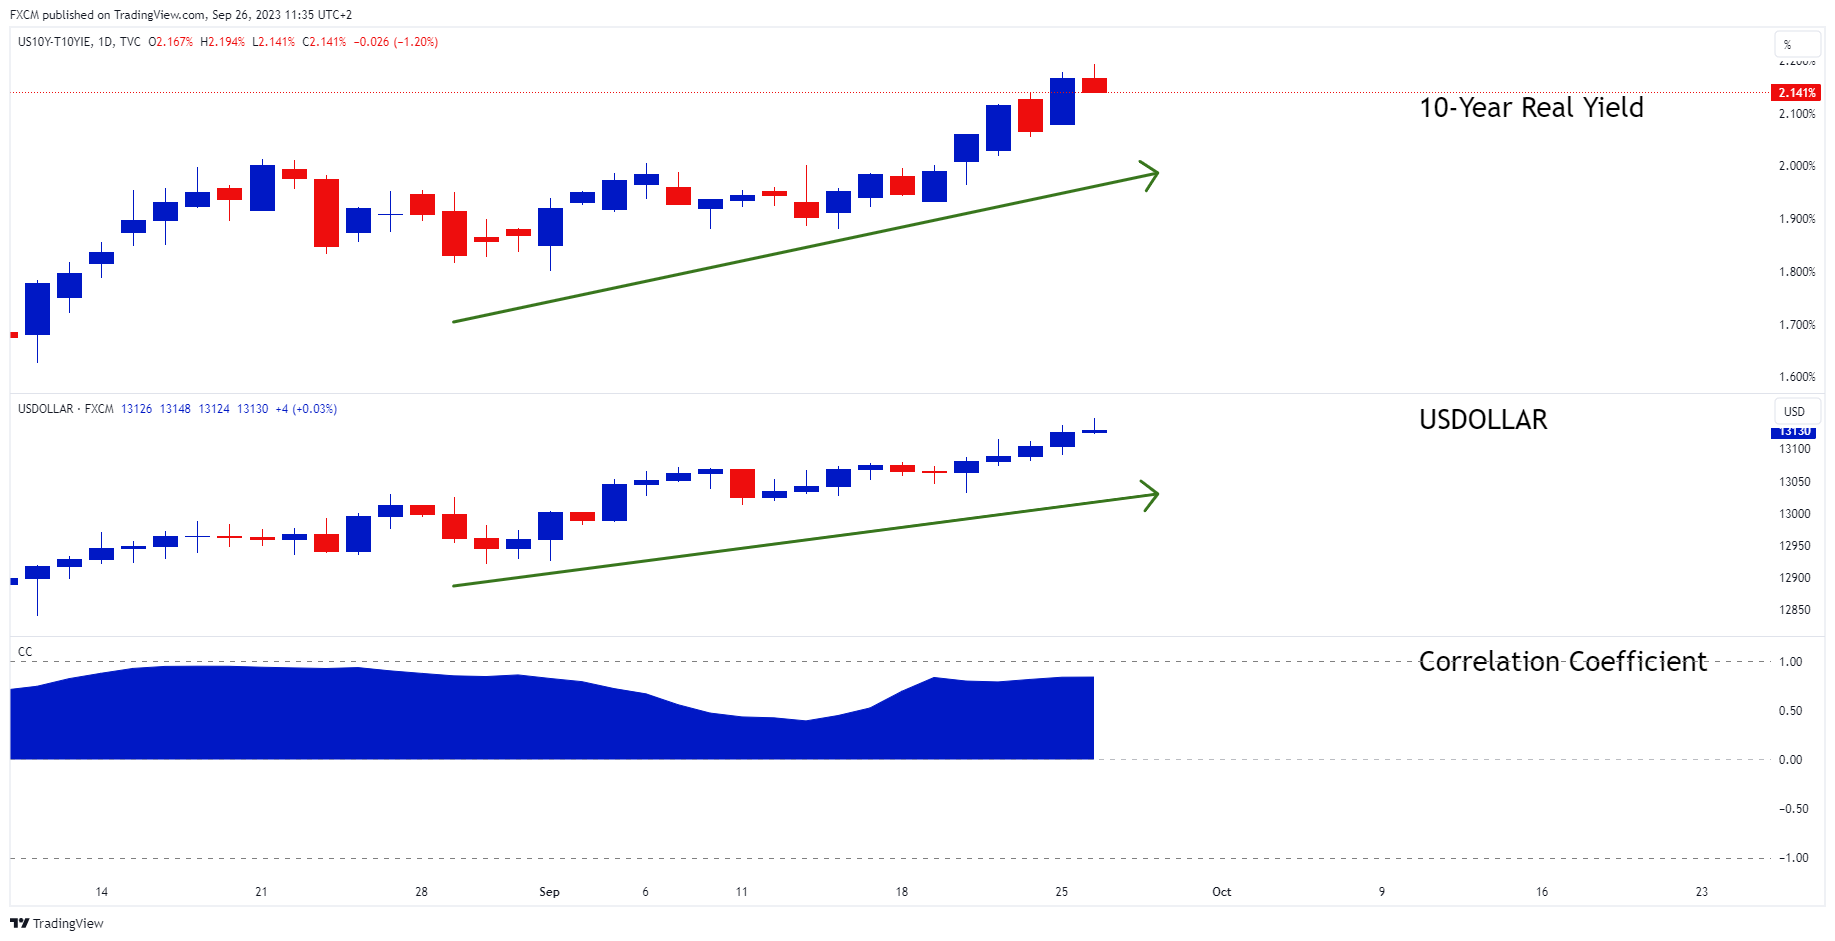
Source: www.tradingview.com
The US 10-year real yield has supported FXCM's USDOLLAR basket. As the real yield has moved up, so has the USDOLLAR (green arrows). The correlation coefficient between the two is a robust 84%. This is not surprising. The higher real yield is likely to exert pressure on the risk side of the market, with the dollar benefitting as a safe-haven.
US 10-Year is Overbought
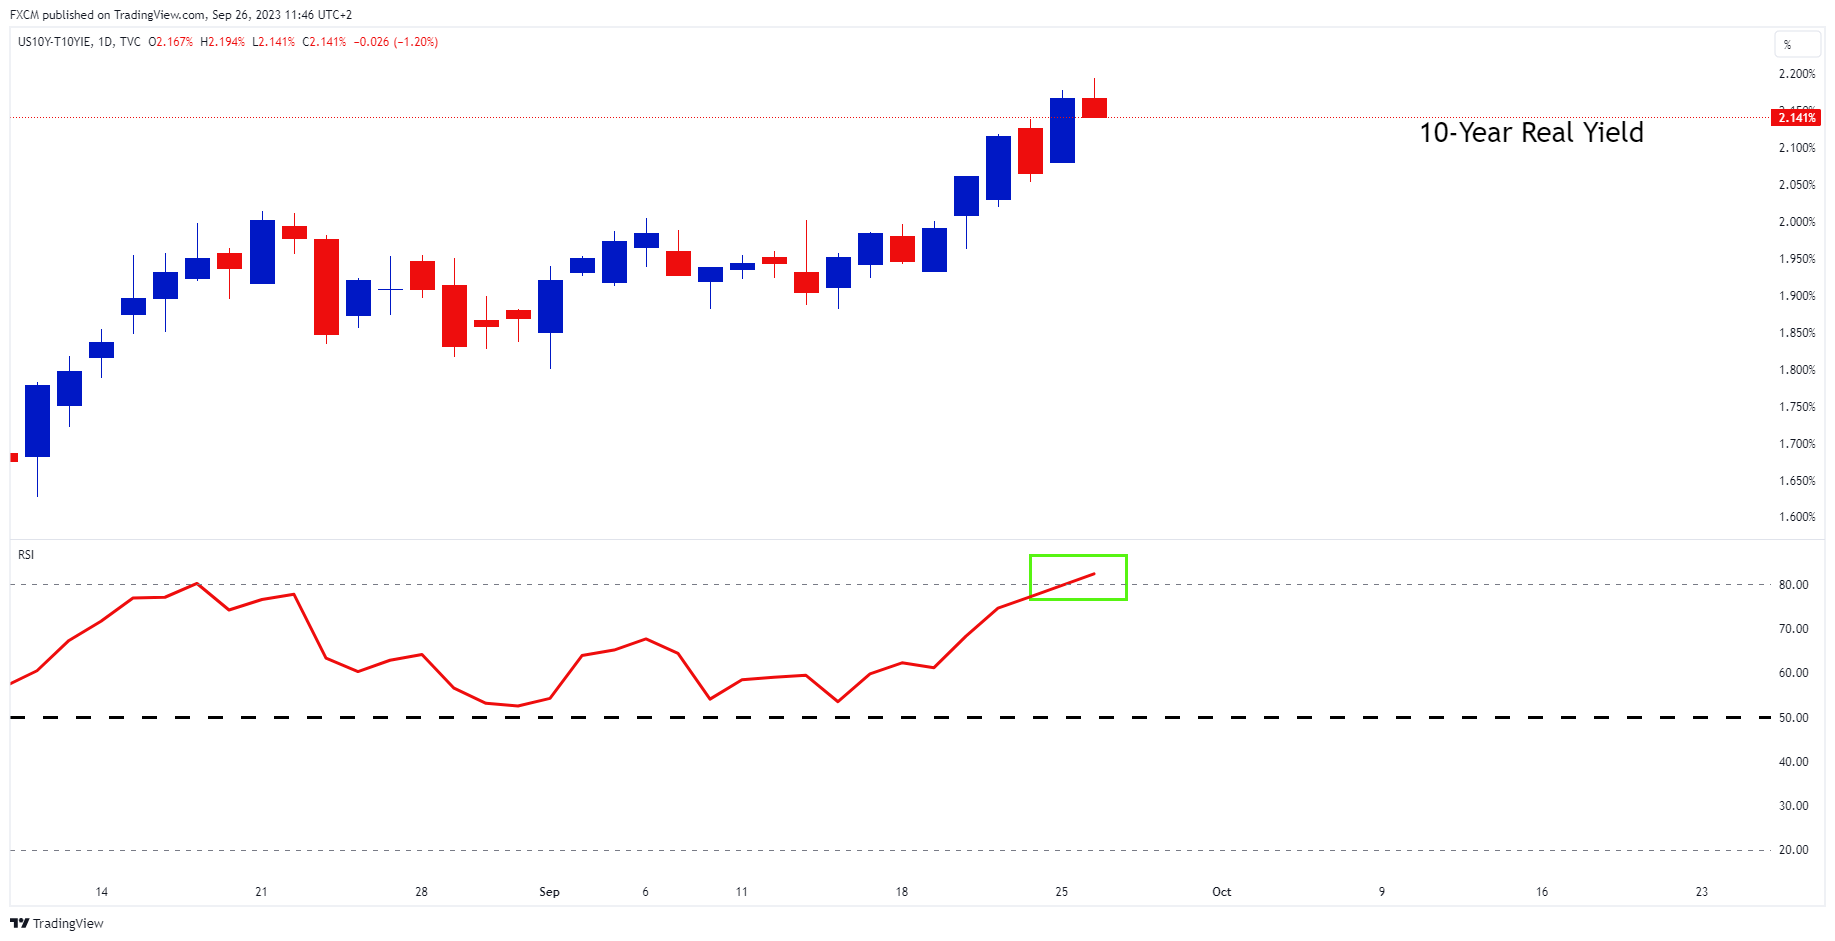
Source: www.tradingview.com
The US 10-year real yield is in uptrend. However, its daily RSI has moved above 80 (green rectangle). This suggests an overbought condition. The RSI tends to spend most of its time between 20 and 80 and only a short amount of time below 20 or above 80. As such, the yield is likely to consolidate or pull back as the RSI normalises in the near-term.
The USDOLLAR is Overbought
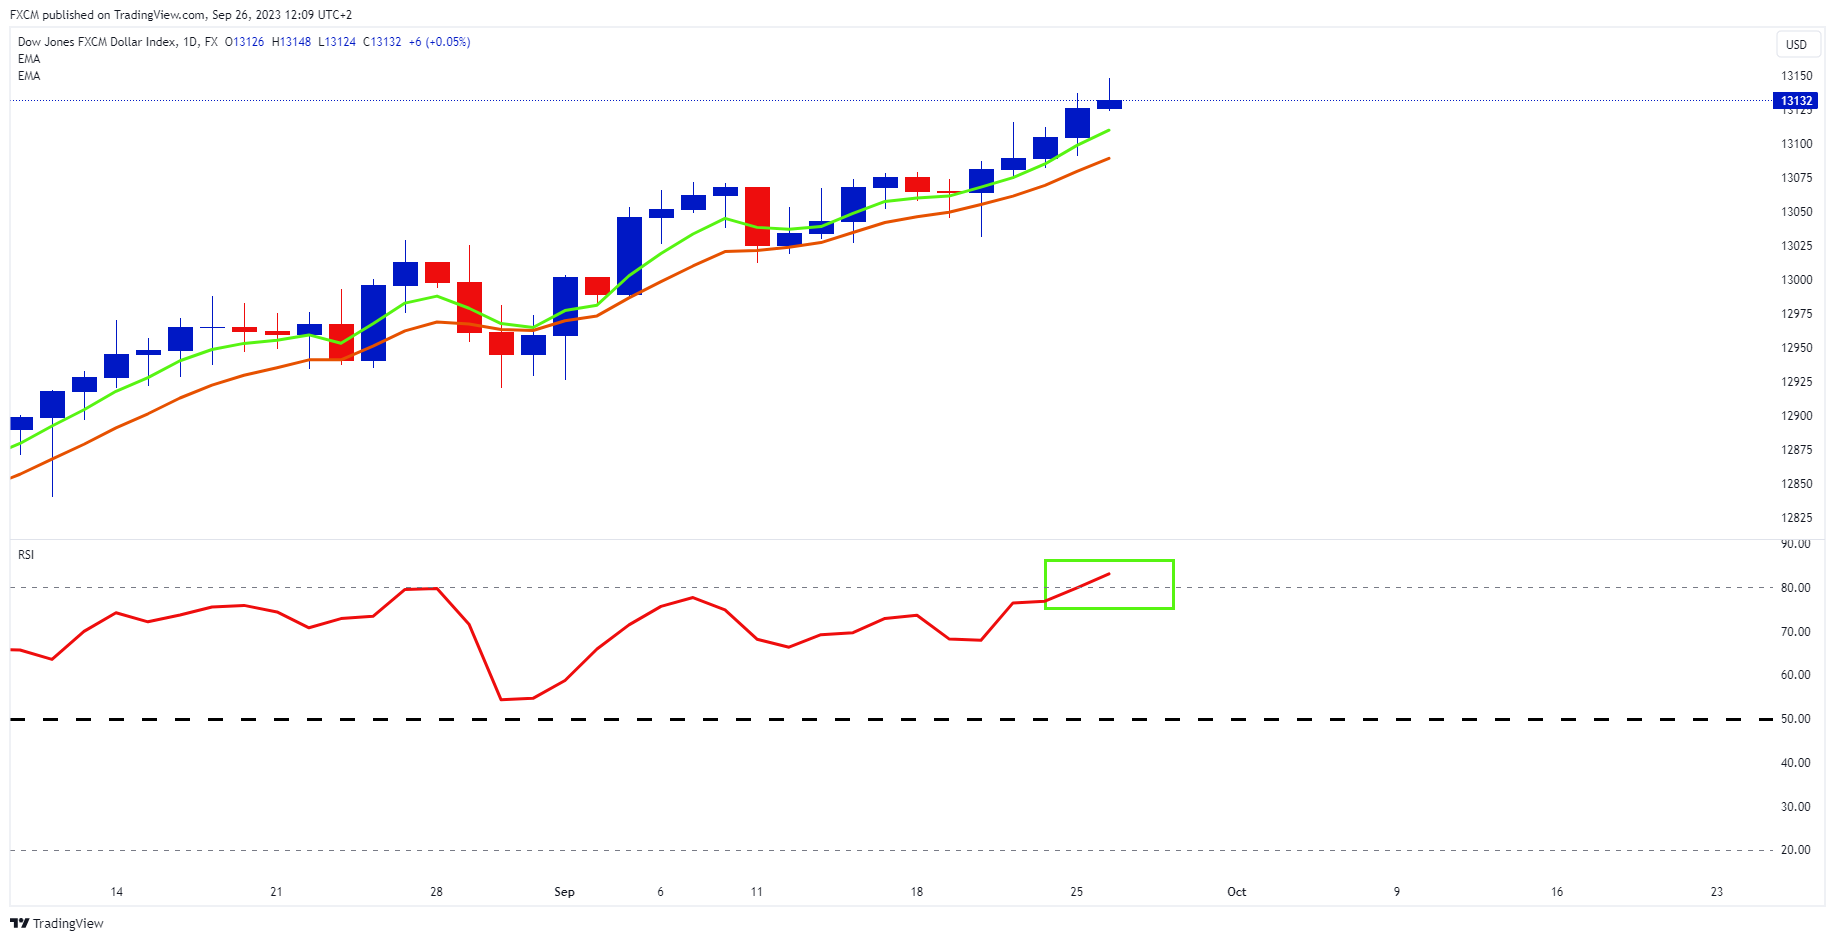
Source: www.tradingview.com
The USDOLLAR is also in uptrend. We have added trend-following indicators here. The green 5-day EMA is above the orange 10-day EMA, which puts the EMAs into a bullish formation. However, like the real yield, the USDOLLAR is overbought. Its green daily RSI is above 80 (green rectangle), which is in abnormal territory. The fact that FXCM's USDOLLAR is overbought is unsurprising given its strong correlation with the real yield.
Conclusion
Both the US 10-year real yield and the USDOLLAR are trending up. Moreover, both are registered as overbought on a technical level. This makes sense given the strong correlation coefficient between the two. This suggests that both the real yield and the USDOLLAR's RSI will need to normalise, implying that there are near-term price ceilings for both instruments.
However, given their uptrends, a pullback here, whilst needed to relieve the overbought condition, may set up a "dip in the uptrend" scenario.

Russell Shor
Senior Market Specialist
Russell Shor joined FXCM in October 2017 as a Senior Market Specialist. He is a certified FMVA® and has an Honours Degree in Economics from the University of South Africa. Russell is a full member of the Society of Technical Analysts in the United Kingdom. With over 20 years of financial markets experience, his analysis is of a high standard and quality.
Any opinions, news, research, analyses, prices, other information, or links to third-party sites contained on this website are provided on an "as-is" basis, as general market commentary and do not constitute investment advice. The market commentary has not been prepared in accordance with legal requirements designed to promote the independence of investment research, and it is therefore not subject to any prohibition on dealing ahead of dissemination. Although this commentary is not produced by an independent source, FXCM takes all sufficient steps to eliminate or prevent any conflicts of interests arising out of the production and dissemination of this communication. The employees of FXCM commit to acting in the clients' best interests and represent their views without misleading, deceiving, or otherwise impairing the clients' ability to make informed investment decisions. For more information about the FXCM's internal organizational and administrative arrangements for the prevention of conflicts, please refer to the Firms' Managing Conflicts Policy. Please ensure that you read and understand our Full Disclaimer and Liability provision concerning the foregoing Information, which can be accessed here.