USDOLLAR in limbo, but upside hinted at

Weekly Chart Analysis
.png)
FXCM's USDOLLAR basket has charted a higher trough (HT) but is yet to chart a higher peak. This leaves the greenback in limbo as we need more price action to assess whether it is trending or consolidating. A higher peak would validate the higher trough, HT, and put the basket into uptrend. A lower peak will suggest a consolidation sideways in a symmetrical triangle formation.
The weekly RSI is above 50 (black ellipse). This is the bullish side of the oscillator. The longer it maintains above 50, the greater the probability that the underlying momentum will support the USDOLLAR and a potential higher peak.
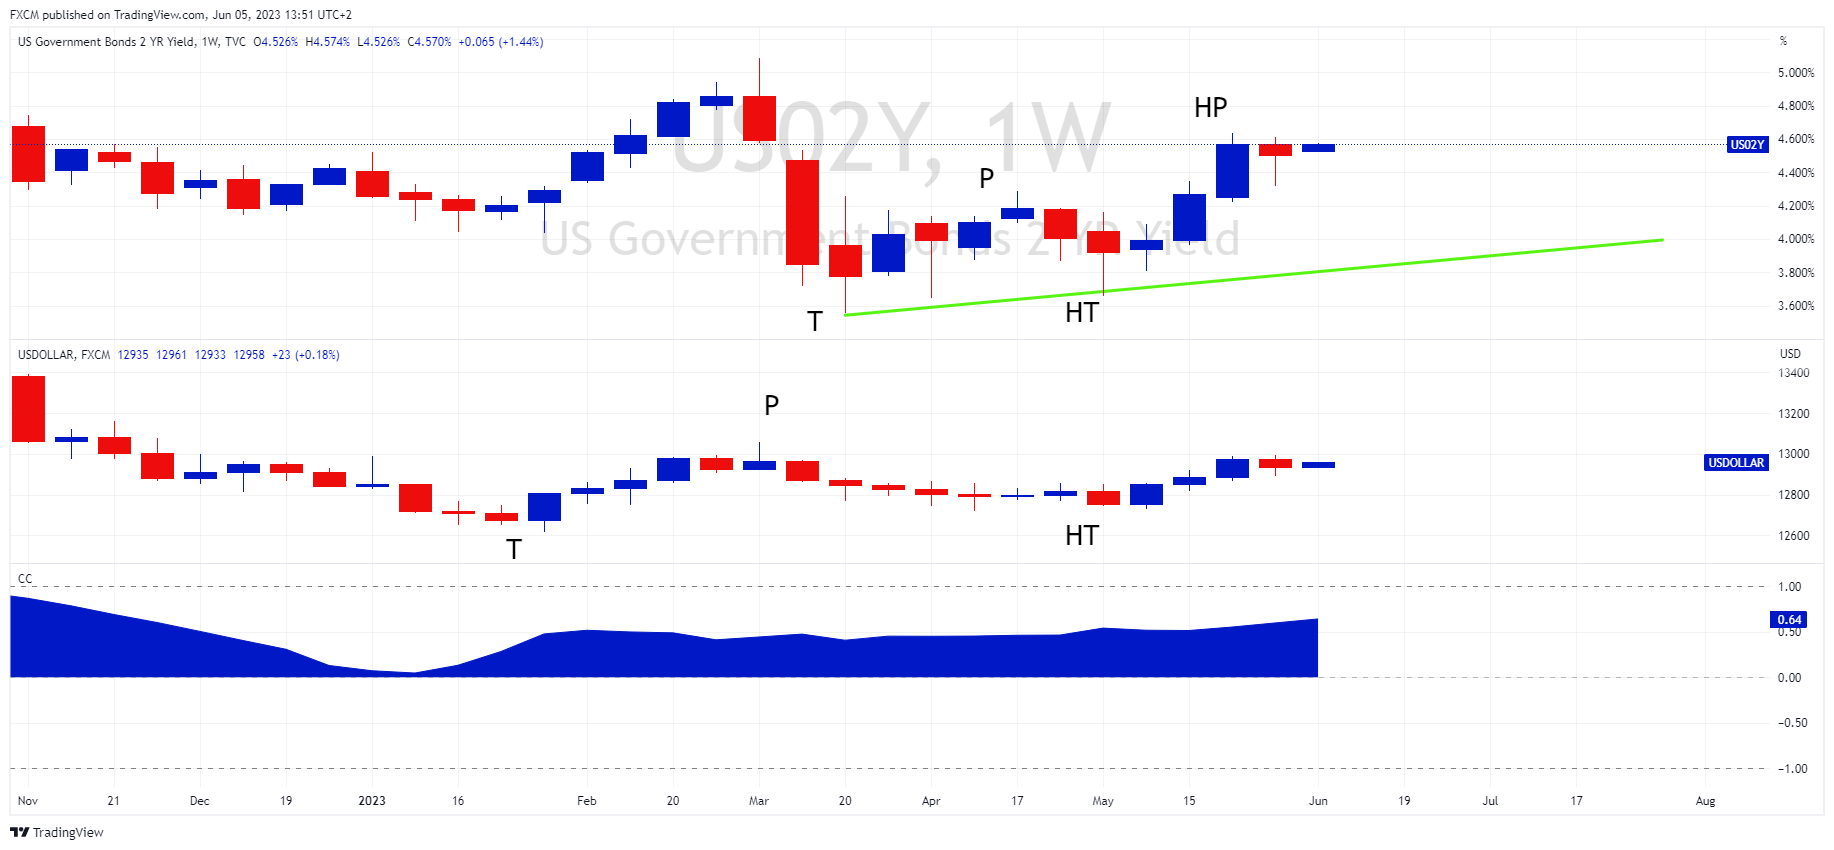
US 02-Year Yield and the USDOLLAR
Source: www.tradingview.com
The US 02-year note may provide another clue. Its yield has charted a higher trough followed by a higher peak and is in uptrend. This instrument is a good proxy for monetary policy because the short-end of the curve responds quickly to changes in costs. It has a correlation coefficient of 64% with the USDOLLAR, which is robust. Therefore, the 02-year yield may lead the greenback higher.
The CME FedWatch Tool has the chance of a pause at the 14 June meeting at 77%, but a 55% chance of a 25bps hike at the 26 July meeting. I.e., the market sees the Fed skipping out on a rate hike before continuing. Hence the uptrend in the US 02-year note.
Daily Chart Analysis
.png)
The USDOLLAR's daily RSI was overbought the last days of May (green rectangle). This prompted a normalisation and the greenback sold down in response. However, the last three candlestick may be charting a higher trough:
- Candle 2 has the lowest low amongst a three-candle cluster.
- Candle 3 has a higher low than candle 2 and looks to be closing above candle 2's high (black horizontal).
- This will be a bullish reference candle reversal.
A bullish reference candle reversal will also put the candlesticks back into the strong channel between the upper blue and red bands. The RSI is on the positive side of 50. The longer it maintains this position and that the candlesticks trade in the bullish channel, the greater the likelihood that a higher peak on the weekly is charted.
Summary
- The USDOLLAR weekly chart is in limbo.
- It has neither confirmed a trend nor a consolidation.
- Its RSI hints at strength.
- This is supported by a hawkish 02-year yield, which is trending up.
- The USDOLLAR is positively correlated to the US 02-year yield.
- The USDOLLAR daily chart is potentially charting a higher trough.
- This may lay the platform for higher prices and a higher peak on the weekly.
Image by NikolayF.com from Pixabay

Russell Shor
Senior Market Specialist
Russell Shor joined FXCM in October 2017 as a Senior Market Specialist. He is a certified FMVA® and has an Honours Degree in Economics from the University of South Africa. Russell is a full member of the Society of Technical Analysts in the United Kingdom. With over 20 years of financial markets experience, his analysis is of a high standard and quality.
Any opinions, news, research, analyses, prices, other information, or links to third-party sites contained on this website are provided on an "as-is" basis, as general market commentary and do not constitute investment advice. The market commentary has not been prepared in accordance with legal requirements designed to promote the independence of investment research, and it is therefore not subject to any prohibition on dealing ahead of dissemination. Although this commentary is not produced by an independent source, FXCM takes all sufficient steps to eliminate or prevent any conflicts of interests arising out of the production and dissemination of this communication. The employees of FXCM commit to acting in the clients' best interests and represent their views without misleading, deceiving, or otherwise impairing the clients' ability to make informed investment decisions. For more information about the FXCM's internal organizational and administrative arrangements for the prevention of conflicts, please refer to the Firms' Managing Conflicts Policy. Please ensure that you read and understand our Full Disclaimer and Liability provision concerning the foregoing Information, which can be accessed here.