USDOLLAR diverges from real yield, a dollar floor may be near in the short-term

Source: www.tradingview.com
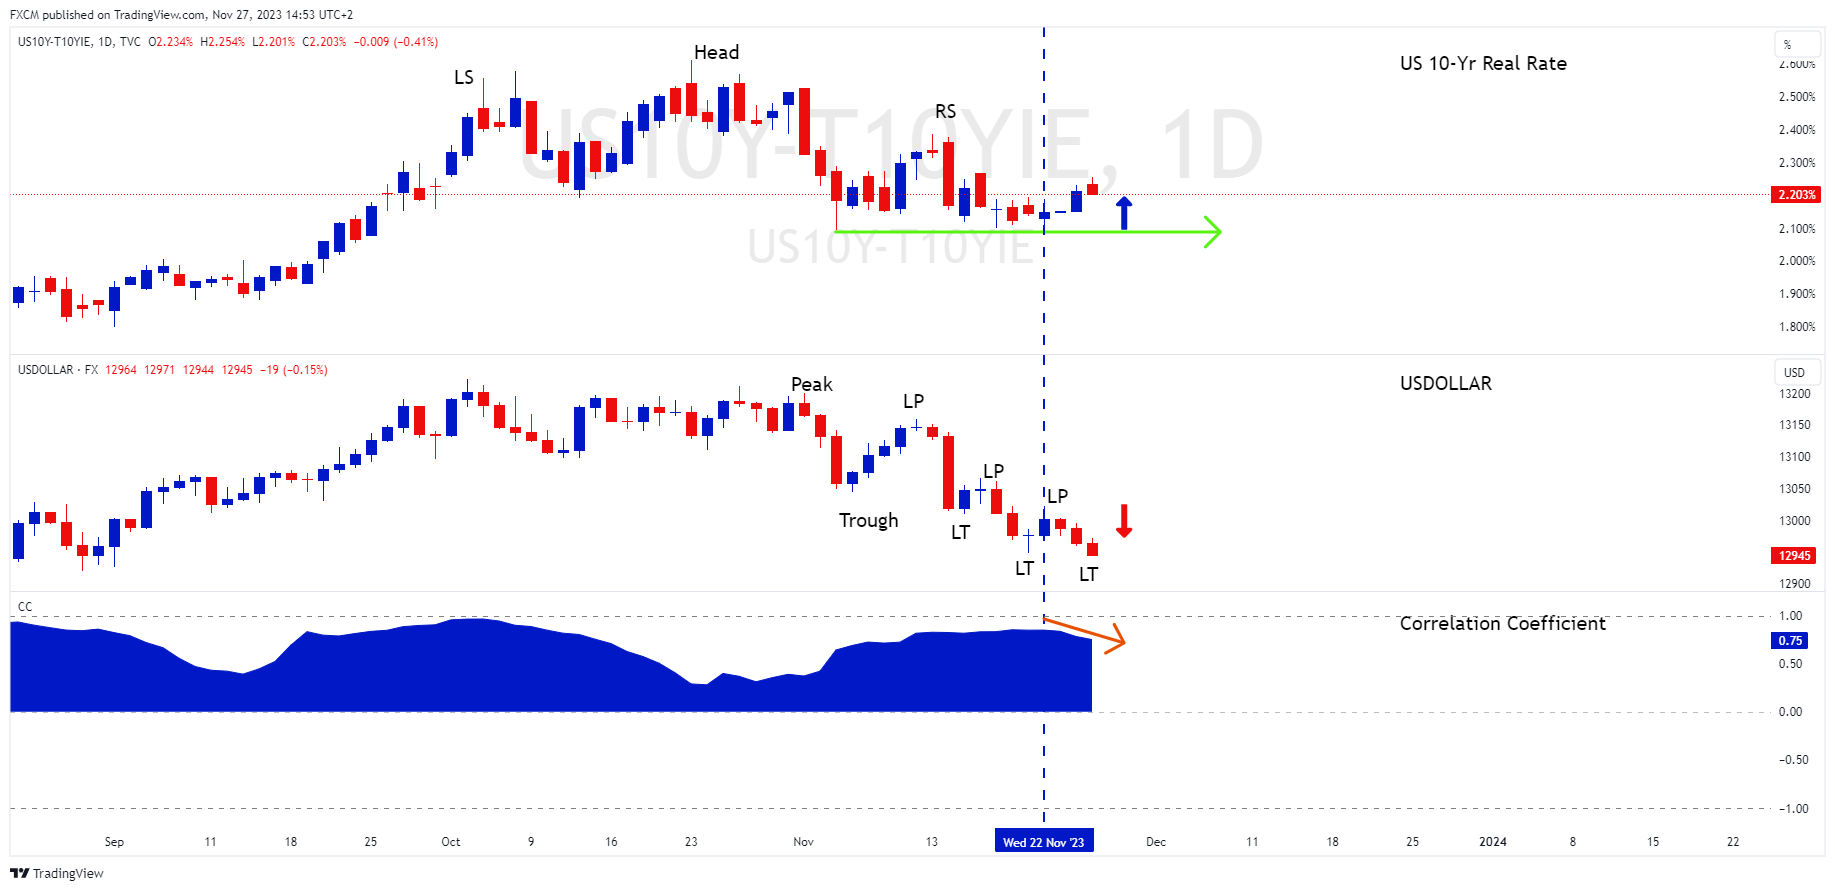
In a previous article we suggested that the US 10-year real rate was topping out and had charted a head and shoulders top. This pattern is still evident but is yet to breakdown. Rather the real yield has found support near the 2.09% (green horizontal arrow). In fact, the real yield has bounced slightly since hitting support and is now trading near 2.20%.
FXCM's USDOLLAR has continued to chart a series of lower peaks followed by lower troughs on its daily timeframe. This puts the daily chart into a defined downtrend. However, this denotes a divergence in behaviour when compared with the real yield.
The blue arrow shows the bounce off the real yield's support at 2.09%, but since 22 November (blue dashed vertical) the USDOLLAR diverged and continued downwards (red arrow). This has resulted in the correlation coefficient (cc) between the two dipping slightly (orange arrow).
Notably, the cc remains a robust and positive 75%. Therefore, if the real yield continues to consolidate around its support level, there may be a floor under FXCM's USDOLLAR. I.e. limited scope for decline until the two series converge again. As such, we continue to closely monitor the USDOLLAR, and its relationship with the real yield.

Russell Shor
Senior Market Specialist
Russell Shor joined FXCM in October 2017 as a Senior Market Specialist. He is a certified FMVA® and has an Honours Degree in Economics from the University of South Africa. Russell is a full member of the Society of Technical Analysts in the United Kingdom. With over 20 years of financial markets experience, his analysis is of a high standard and quality.
Any opinions, news, research, analyses, prices, other information, or links to third-party sites contained on this website are provided on an "as-is" basis, as general market commentary and do not constitute investment advice. The market commentary has not been prepared in accordance with legal requirements designed to promote the independence of investment research, and it is therefore not subject to any prohibition on dealing ahead of dissemination. Although this commentary is not produced by an independent source, FXCM takes all sufficient steps to eliminate or prevent any conflicts of interests arising out of the production and dissemination of this communication. The employees of FXCM commit to acting in the clients' best interests and represent their views without misleading, deceiving, or otherwise impairing the clients' ability to make informed investment decisions. For more information about the FXCM's internal organizational and administrative arrangements for the prevention of conflicts, please refer to the Firms' Managing Conflicts Policy. Please ensure that you read and understand our Full Disclaimer and Liability provision concerning the foregoing Information, which can be accessed here.