USDOLLAR charts bearish wedge pattern into Wednesday’s FOMC statement

Source: www.tradingview.com
Core PCE has come in at 2.9% y/y, with a strong showing in disinflation towards the Federal Reserve's target of 2%. The monthly number is 0.17%, which annualises to 2.01%. There is a general confidence that the Federal Reserve is well on its way to hitting its inflation target, with the market currently giving a 50-50 chance of a 25bps cut in March and a 90% chance in May.
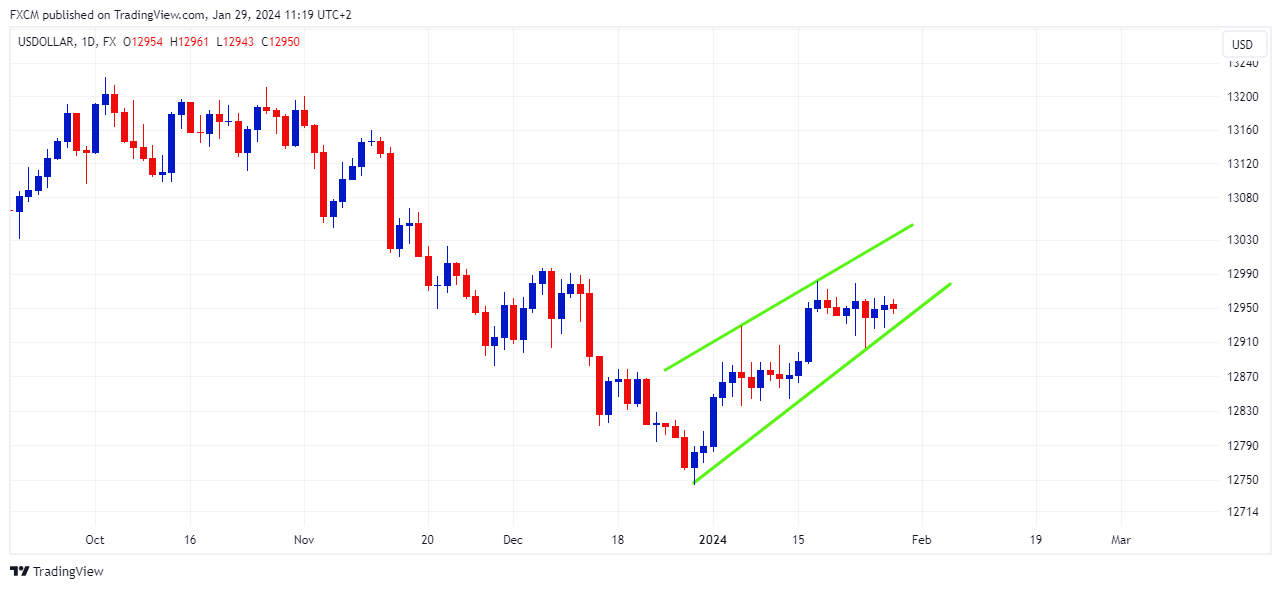
FXCM's USDOLLAR basket had a strong start to the year until mid-January. Since then, it has been treading water and moving sideways as the market mulls the likelihood of a March rate cut.
There is a general sense of a Goldilocks economy as Advance GDP q/q, released on Thursday, beat expectations, printing at 3.3%. Such a scenario is likely to see capital rotate out of the dollar safe-haven and into risk, as long as economic growth remains resilient. To this end, the USDOLLAR seems to have charted a bearish wedge pattern (green converging trendlines).
We highlight the FOMC statement (7:00pm GMT) and press conference (7:30pm GMT) on Wednesday. A dovish tone in communication will likely coincide with a breakdown in the wedge pattern if there is a perceptible increase in the likelihood of a March cut.

Russell Shor
Senior Market Specialist
Russell Shor joined FXCM in October 2017 as a Senior Market Specialist. He is a certified FMVA® and has an Honours Degree in Economics from the University of South Africa. Russell is a full member of the Society of Technical Analysts in the United Kingdom. With over 20 years of financial markets experience, his analysis is of a high standard and quality.
Any opinions, news, research, analyses, prices, other information, or links to third-party sites contained on this website are provided on an "as-is" basis, as general market commentary and do not constitute investment advice. The market commentary has not been prepared in accordance with legal requirements designed to promote the independence of investment research, and it is therefore not subject to any prohibition on dealing ahead of dissemination. Although this commentary is not produced by an independent source, FXCM takes all sufficient steps to eliminate or prevent any conflicts of interests arising out of the production and dissemination of this communication. The employees of FXCM commit to acting in the clients' best interests and represent their views without misleading, deceiving, or otherwise impairing the clients' ability to make informed investment decisions. For more information about the FXCM's internal organizational and administrative arrangements for the prevention of conflicts, please refer to the Firms' Managing Conflicts Policy. Please ensure that you read and understand our Full Disclaimer and Liability provision concerning the foregoing Information, which can be accessed here.