US2000 Breakout After 2021 Consolidation
Past performance is not an indicator of future results
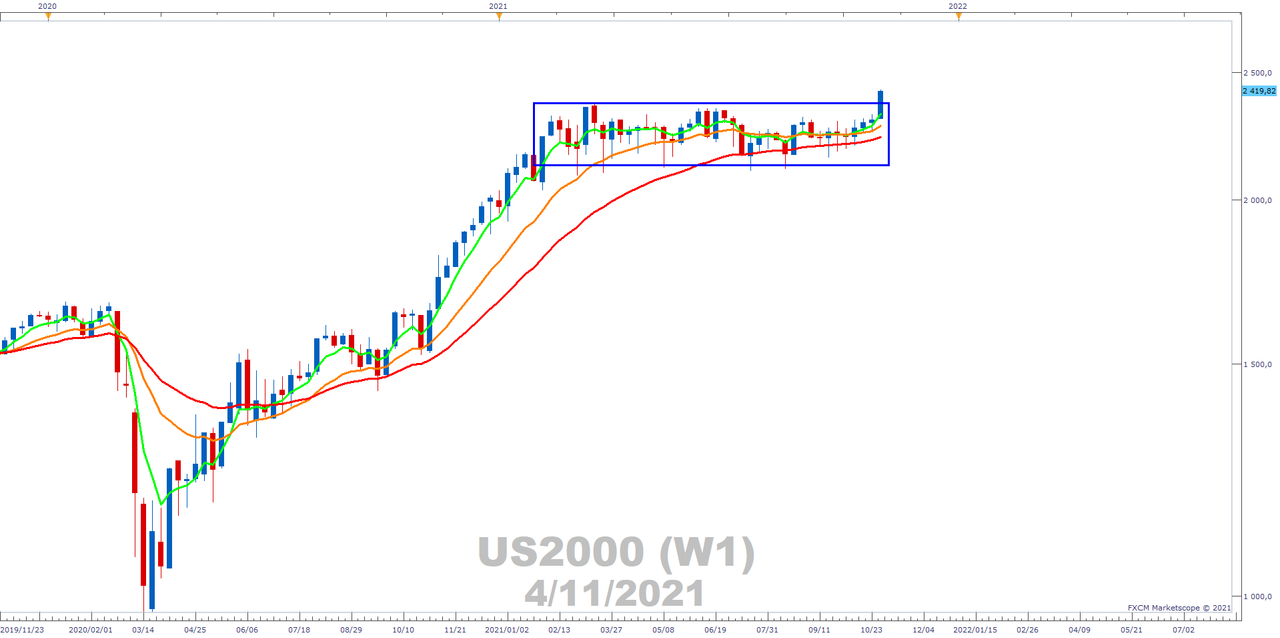
FXCM's US2000, its proxy for the small-cap Russell 2000, has broken out of its 2021 consolidation (blue rectangle). We have applied a triple moving average to test the trendiness of the breakout. The green short EMA is above the orange mid-EMA, and the orange mid-EMA is above the red long EMA. We also note that the EMAs are developing angle and separation. If this continues it will be indicative of underlying bullish momentum.
The long blue rectangle base of 2021 represents an area where the bulls and bears were in equilibrium in terms of valuation consensus. The breakout shows that it might be the bulls that have now taken control. This will be the case if the EMAs are able to maintain their bullish stack.
One concern is interest rates. If they move higher this may impact the performance of small-caps. This is because they tend to usually have access to funds at a higher rate than the larger-cap stocks. We do note that on a shorter-term basis risk markets look frothy and some selling is due. However, if the US2000 holds a bullish weekly chart pattern, it may serve as a catalyst for buying into any dips that materialise.

Russell Shor
Senior Market Specialist
Russell Shor joined FXCM in October 2017 as a Senior Market Specialist. He is a certified FMVA® and has an Honours Degree in Economics from the University of South Africa. Russell is a full member of the Society of Technical Analysts in the United Kingdom. With over 20 years of financial markets experience, his analysis is of a high standard and quality.
Any opinions, news, research, analyses, prices, other information, or links to third-party sites contained on this website are provided on an "as-is" basis, as general market commentary and do not constitute investment advice. The market commentary has not been prepared in accordance with legal requirements designed to promote the independence of investment research, and it is therefore not subject to any prohibition on dealing ahead of dissemination. Although this commentary is not produced by an independent source, FXCM takes all sufficient steps to eliminate or prevent any conflicts of interests arising out of the production and dissemination of this communication. The employees of FXCM commit to acting in the clients' best interests and represent their views without misleading, deceiving, or otherwise impairing the clients' ability to make informed investment decisions. For more information about the FXCM's internal organizational and administrative arrangements for the prevention of conflicts, please refer to the Firms' Managing Conflicts Policy. Please ensure that you read and understand our Full Disclaimer and Liability provision concerning the foregoing Information, which can be accessed here.