US Oil Tepid After 2-Month Highs

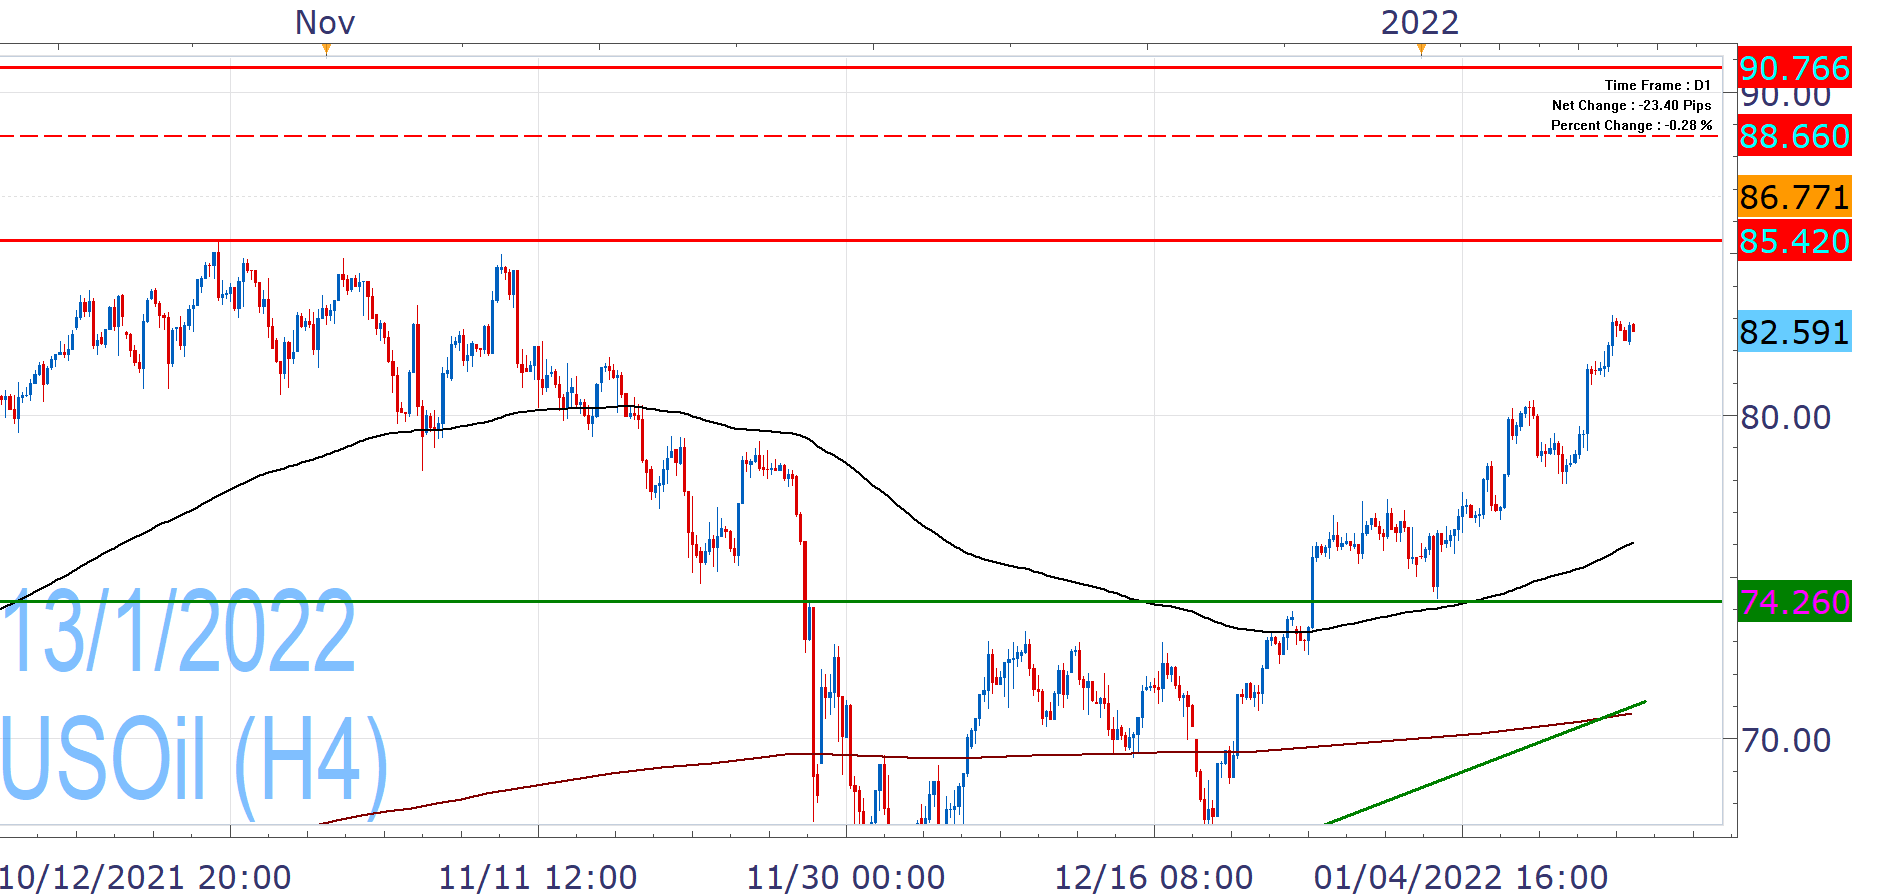
USOIL – H4
The commodity had a poor November, but December was profitable and the new year has started on the offensive, with the current week being the fourth straight profitable one.
This led to two-month highs yesterday, which have opened the door towards October's multi-year highs (85,42), but we are not sure that it is ready to surpass it and bring 90.76 into the spotlight.
The move seems overextended and October's highs had led to the previously mentioned November decline, so a correction from these levels could be in the cards. As such we could see pressure towards 80.49-79.94, but the downside seems to have multiple support levels. For the upside momentum to pause, a break below the EMA200 would be required (76.10-58).
Today's calendar is light, with US PPI and Jobless claims standing out, while Fed's Ms Brainard testifies in the Senate.
Past Performance: Past Performance is not an indicator of future results.

Nikos Tzabouras
Senior Financial Editorial Writer
Nikos Tzabouras is a graduate of the Department of International & European Economic Studies at the Athens University of Economics and Business. He has a long time presence at FXCM, as he joined the company in 2011. He has served from multiple positions, but specializes in financial market analysis and commentary.
With his educational background in international relations, he emphasizes not only on Technical Analysis but also in Fundamental Analysis and Geopolitics – which have been having increasing impact on financial markets. He has longtime experience in market analysis and as a host of educational trading courses via online and in-person sessions and conferences.
Any opinions, news, research, analyses, prices, other information, or links to third-party sites contained on this website are provided on an "as-is" basis, as general market commentary and do not constitute investment advice. The market commentary has not been prepared in accordance with legal requirements designed to promote the independence of investment research, and it is therefore not subject to any prohibition on dealing ahead of dissemination. Although this commentary is not produced by an independent source, FXCM takes all sufficient steps to eliminate or prevent any conflicts of interests arising out of the production and dissemination of this communication. The employees of FXCM commit to acting in the clients' best interests and represent their views without misleading, deceiving, or otherwise impairing the clients' ability to make informed investment decisions. For more information about the FXCM's internal organizational and administrative arrangements for the prevention of conflicts, please refer to the Firms' Managing Conflicts Policy. Please ensure that you read and understand our Full Disclaimer and Liability provision concerning the foregoing Information, which can be accessed here.