The Market Seems To Be Celebrating Netflix’s Q3 Earnings, Pushing For Outperformance of Broader Index

Comment
The market seems to be cheering Netflix's (NFLX.us) Q3 results. Released after the market close last week Wednesday, 18 October, the Q3 results showed that nearly 8.8m net new subscribers were added for the quarter. This is the highest number in years.
Netflix has cracked down on password sharing and introduced lower priced-subscription tiers that support ads. These changes are yielding results.
For Q3, Netflix's operating margin was 22.4%, which was higher than expected. The company's quarterly free cash flow was $1.9m, which saw management upping full year guidance to $6.5bn, up from $5bn.
Netflix expects operating margin for 2024 to be 22%-23%, its best profitability to date. The Netflix share price has been struggling since July, but the technical makeup is improving following the earnings release.
Technical Analysis
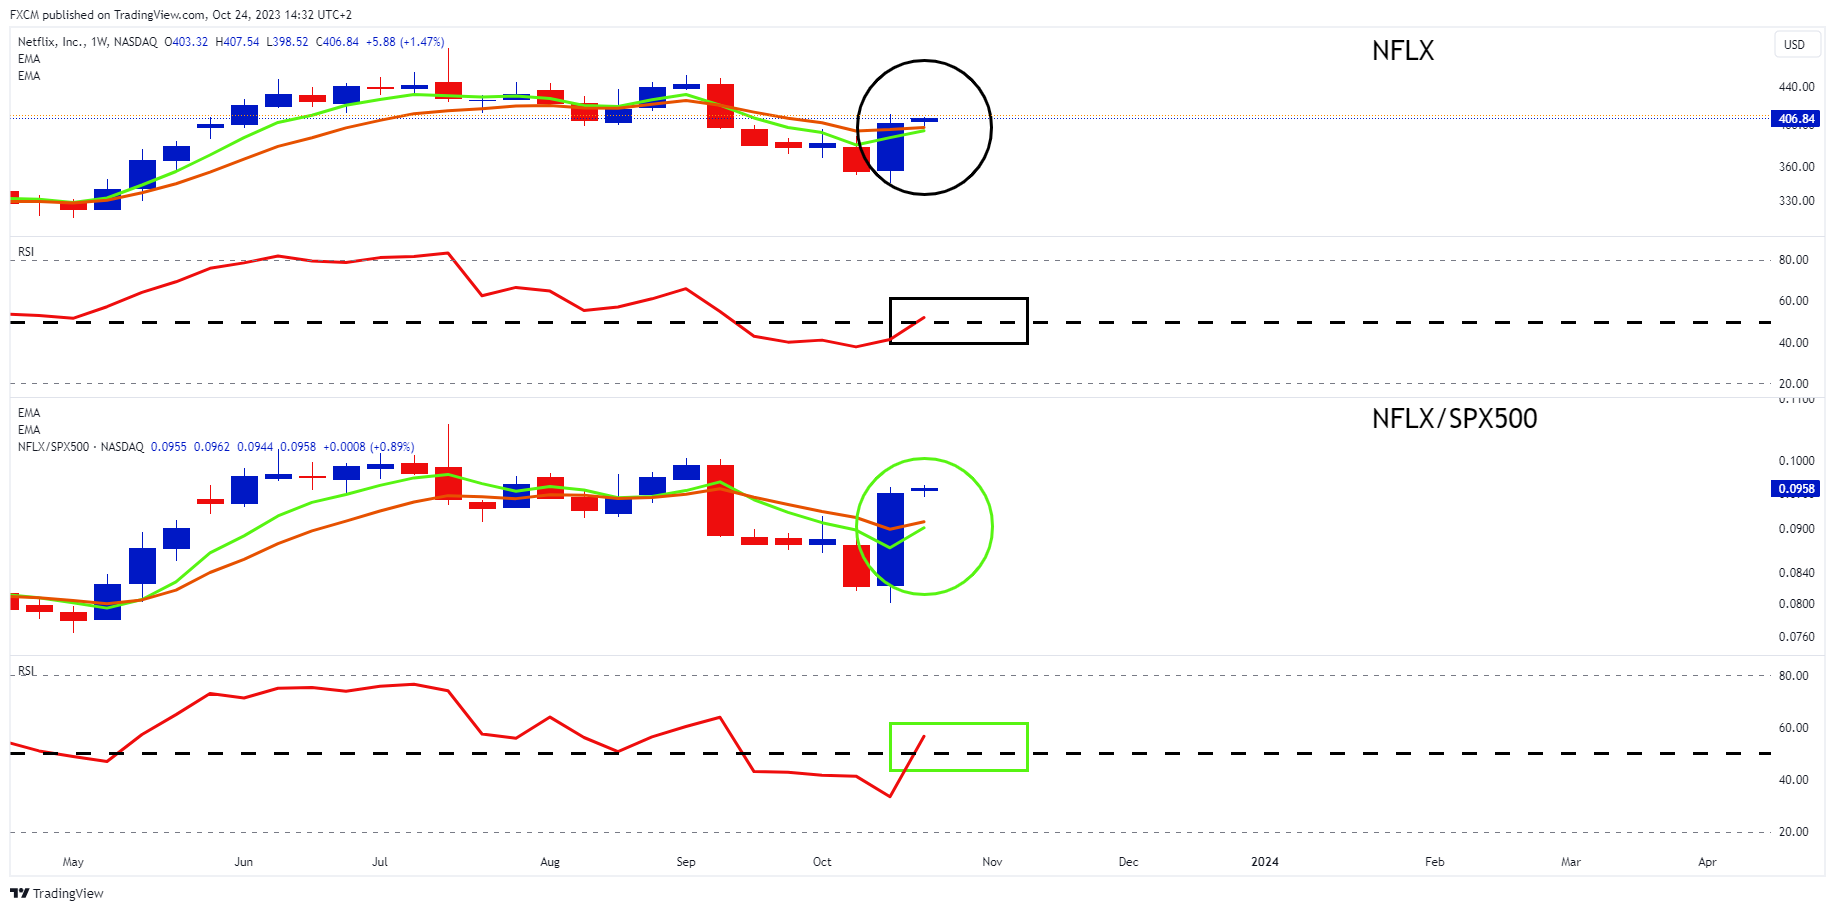
Source: www.tradingview.com
Netflix's green 5-week EMA is looking to cross above its orange 10-week EMA (black circle). Its RSI has already popped above 50 (black rectangle), which puts it on the bullish side of the indicator. If it maintains above 50, the EMAs should cross, which would put them into bullish formation.
Moreover, the relative strength chart (NFLX/SPX500) shows that NFLX may move into an outperforming position compared to the broader index. The relative strength chart's green 5-week EMA is also looking to cross above its orange 10-week EMA, which would be a bullish development. The relative strength momentum is already favouring an outperformance, with the RSI moving to the bullish side of 50 (green rectangle). If the RSI maintains this position, NFLX.us should outperform the SPX500.

Russell Shor
Senior Market Specialist
Russell Shor joined FXCM in October 2017 as a Senior Market Specialist. He is a certified FMVA® and has an Honours Degree in Economics from the University of South Africa. Russell is a full member of the Society of Technical Analysts in the United Kingdom. With over 20 years of financial markets experience, his analysis is of a high standard and quality.
Any opinions, news, research, analyses, prices, other information, or links to third-party sites contained on this website are provided on an "as-is" basis, as general market commentary and do not constitute investment advice. The market commentary has not been prepared in accordance with legal requirements designed to promote the independence of investment research, and it is therefore not subject to any prohibition on dealing ahead of dissemination. Although this commentary is not produced by an independent source, FXCM takes all sufficient steps to eliminate or prevent any conflicts of interests arising out of the production and dissemination of this communication. The employees of FXCM commit to acting in the clients' best interests and represent their views without misleading, deceiving, or otherwise impairing the clients' ability to make informed investment decisions. For more information about the FXCM's internal organizational and administrative arrangements for the prevention of conflicts, please refer to the Firms' Managing Conflicts Policy. Please ensure that you read and understand our Full Disclaimer and Liability provision concerning the foregoing Information, which can be accessed here.