The current gold rally looks suspiciously like a correction

Source: www.tradingview.com
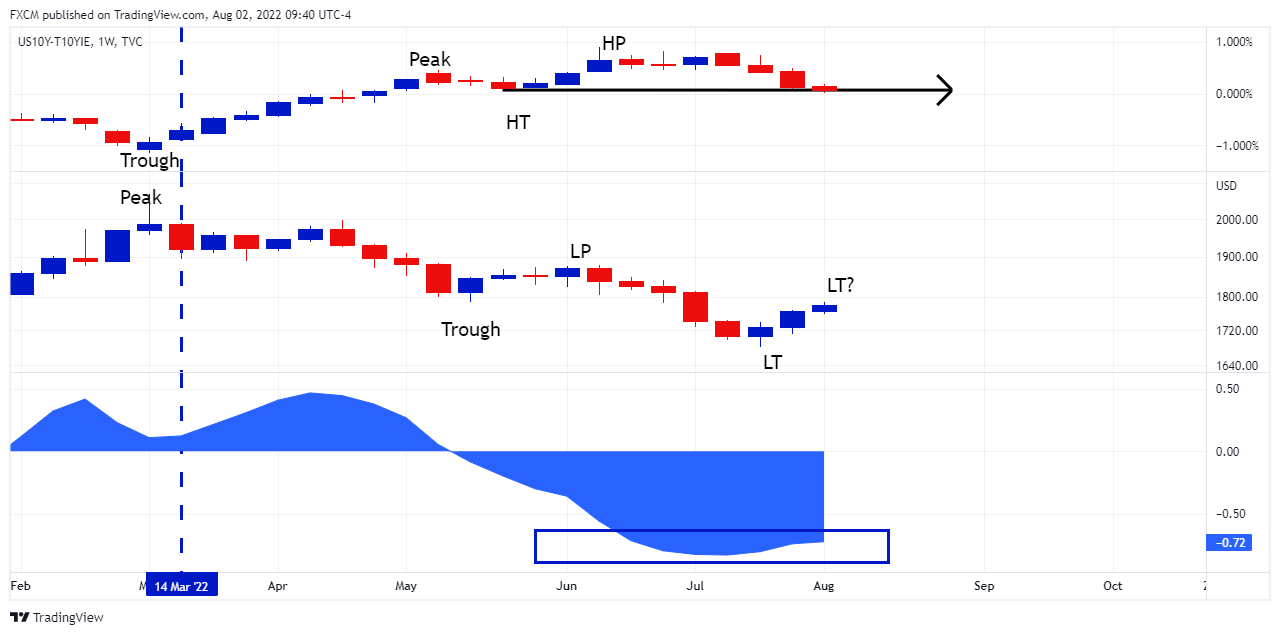
In our opinion, the FOMC press release of March 16 (blue dashed vertical) marks a significant pivot to market dynamics. This announcement included the Fed's confirmation of its intent to normalise its balance sheet through quantitative tightening (QT). Since then, intermarket relationships have emerged as the markets discount the siphoning of liquidity out of the economy.
One such relationship is between real rates and gold. As real rates charted a higher trough (HT) followed by a higher peak (HP), XAUUSD (middle) charted a lower peak (LP) followed by a lower trough (LT). As a result, real interest rates turned positive, and the correlation coefficient between the two, which was positive, swivelled and turned negative. The inverse relationship has now locked in at a strong -0.72 correlation coefficient (blue rectangle).
This association suggests that, given the market turmoil, market participants chose to rotate funds towards the positive real rate, at the expense of the precious metal. This direction intuitively makes sense.
QT implies a scarcer dollar, which is greenback supportive. Because gold is priced in dollars (now to be supported), the natural flow would be from gold towards favourable real rates.
Since July 18, real rates have fallen, and, sensically, XAUUSD has benefitted as participants reversed the money flow. However, it is unlikely that real rates will be able to switch permanently due to the Fed's war on inflation. If this assumption is correct, the current rally in gold may chart the next lower peak in the series. I.e. a rally in a broader downtrend scenario. We continue to monitor for signs of a swing high as this will be the precursor if gold is set for another leg down.

Russell Shor
Senior Market Specialist
Russell Shor joined FXCM in October 2017 as a Senior Market Specialist. He is a certified FMVA® and has an Honours Degree in Economics from the University of South Africa. Russell is a full member of the Society of Technical Analysts in the United Kingdom. With over 20 years of financial markets experience, his analysis is of a high standard and quality.
Any opinions, news, research, analyses, prices, other information, or links to third-party sites contained on this website are provided on an "as-is" basis, as general market commentary and do not constitute investment advice. The market commentary has not been prepared in accordance with legal requirements designed to promote the independence of investment research, and it is therefore not subject to any prohibition on dealing ahead of dissemination. Although this commentary is not produced by an independent source, FXCM takes all sufficient steps to eliminate or prevent any conflicts of interests arising out of the production and dissemination of this communication. The employees of FXCM commit to acting in the clients' best interests and represent their views without misleading, deceiving, or otherwise impairing the clients' ability to make informed investment decisions. For more information about the FXCM's internal organizational and administrative arrangements for the prevention of conflicts, please refer to the Firms' Managing Conflicts Policy. Please ensure that you read and understand our Full Disclaimer and Liability provision concerning the foregoing Information, which can be accessed here.