Technical Pattern Suggest Generous Price Target for Tesla

Weekly Chart Analysis
.png)
Source: Marketscope 2.0
Tesla (TSLA.us) is trading around $241. This is around 40% lower than its all-time high of $414 reached in November 2021. However, the Tesla (TSLA.us) weekly chart is showing interesting potential.
- The stock is trading in a bullish flag pattern.
- Theory suggests that "flags fly at half-mast."
- This being the case, the measured move gives a generous upside target of $488, which is more than double Tesla's current price.
- Measured moves are academic, in nature, and may or may not be hit.
- Nevertheless, the measured move does connote an underlying bullish potential.
- For Tesla to move towards the flag's target, the pattern, at least, needs to complete with price breaking out of the pattern at C
There are some technical positives that suggest a pattern breakout is imminent. Firstly, price is above its black 30-week exponential moving average, and the EMA has turned up (at A). Moreover, the RSI's black trendline has been broken to the upside at B. This suggests an expansion in the underlying bullish momentum.
Daily Chart Analysis
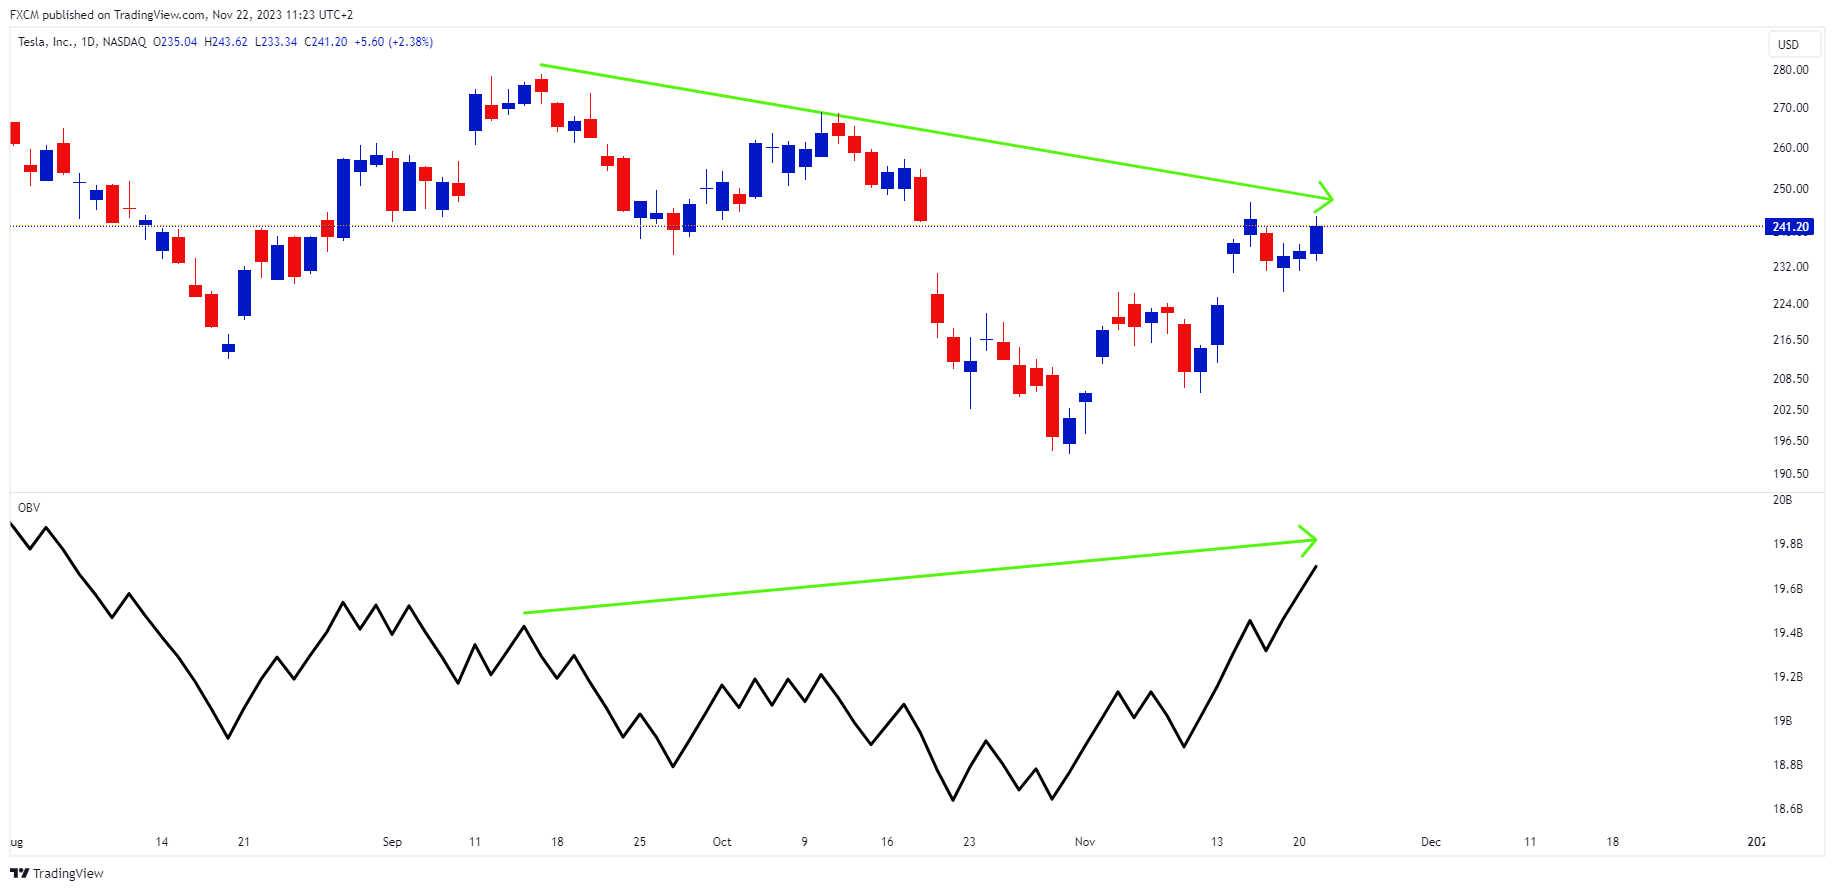
Source: www.tradingview.com
Tesla has declined since the middle of September, but the on-balance volume indicator shows a positive divergence and is higher than its September value (green arrows). This indicates that Tesla (TSLA.us) is being accumulated by portfolio managers in anticipation. Accumulation has been particularly strong during this month of November.
Comment
Barron's cites a few reasons for a stronger Tesla:
- Tesla is distributing a new version of Full Self Driving (version 12), its driver-assistance software, which has several improvements. This may be purchased for $12,000 or $199 per month. Tesla wants FSD to become so advanced that drivers will be able to stop paying attention to the road.
- Electric vehicle growth has been positive, with European registrations growing by 30% annually in October. Tesla's market share here has expanded from 13% to 18%.
- Although Tesla has embarked on significant price cuts throughout the year, transaction prices in the US increased by 5% in October from September. This is the first monthly increase this year which will likely be celebrated by investors.

Russell Shor
Senior Market Specialist
Russell Shor joined FXCM in October 2017 as a Senior Market Specialist. He is a certified FMVA® and has an Honours Degree in Economics from the University of South Africa. Russell is a full member of the Society of Technical Analysts in the United Kingdom. With over 20 years of financial markets experience, his analysis is of a high standard and quality.
Any opinions, news, research, analyses, prices, other information, or links to third-party sites contained on this website are provided on an "as-is" basis, as general market commentary and do not constitute investment advice. The market commentary has not been prepared in accordance with legal requirements designed to promote the independence of investment research, and it is therefore not subject to any prohibition on dealing ahead of dissemination. Although this commentary is not produced by an independent source, FXCM takes all sufficient steps to eliminate or prevent any conflicts of interests arising out of the production and dissemination of this communication. The employees of FXCM commit to acting in the clients' best interests and represent their views without misleading, deceiving, or otherwise impairing the clients' ability to make informed investment decisions. For more information about the FXCM's internal organizational and administrative arrangements for the prevention of conflicts, please refer to the Firms' Managing Conflicts Policy. Please ensure that you read and understand our Full Disclaimer and Liability provision concerning the foregoing Information, which can be accessed here.