SPX500 weekly uptrend but eyes on tomorrow’s CPI

Source: www.tradingview.com
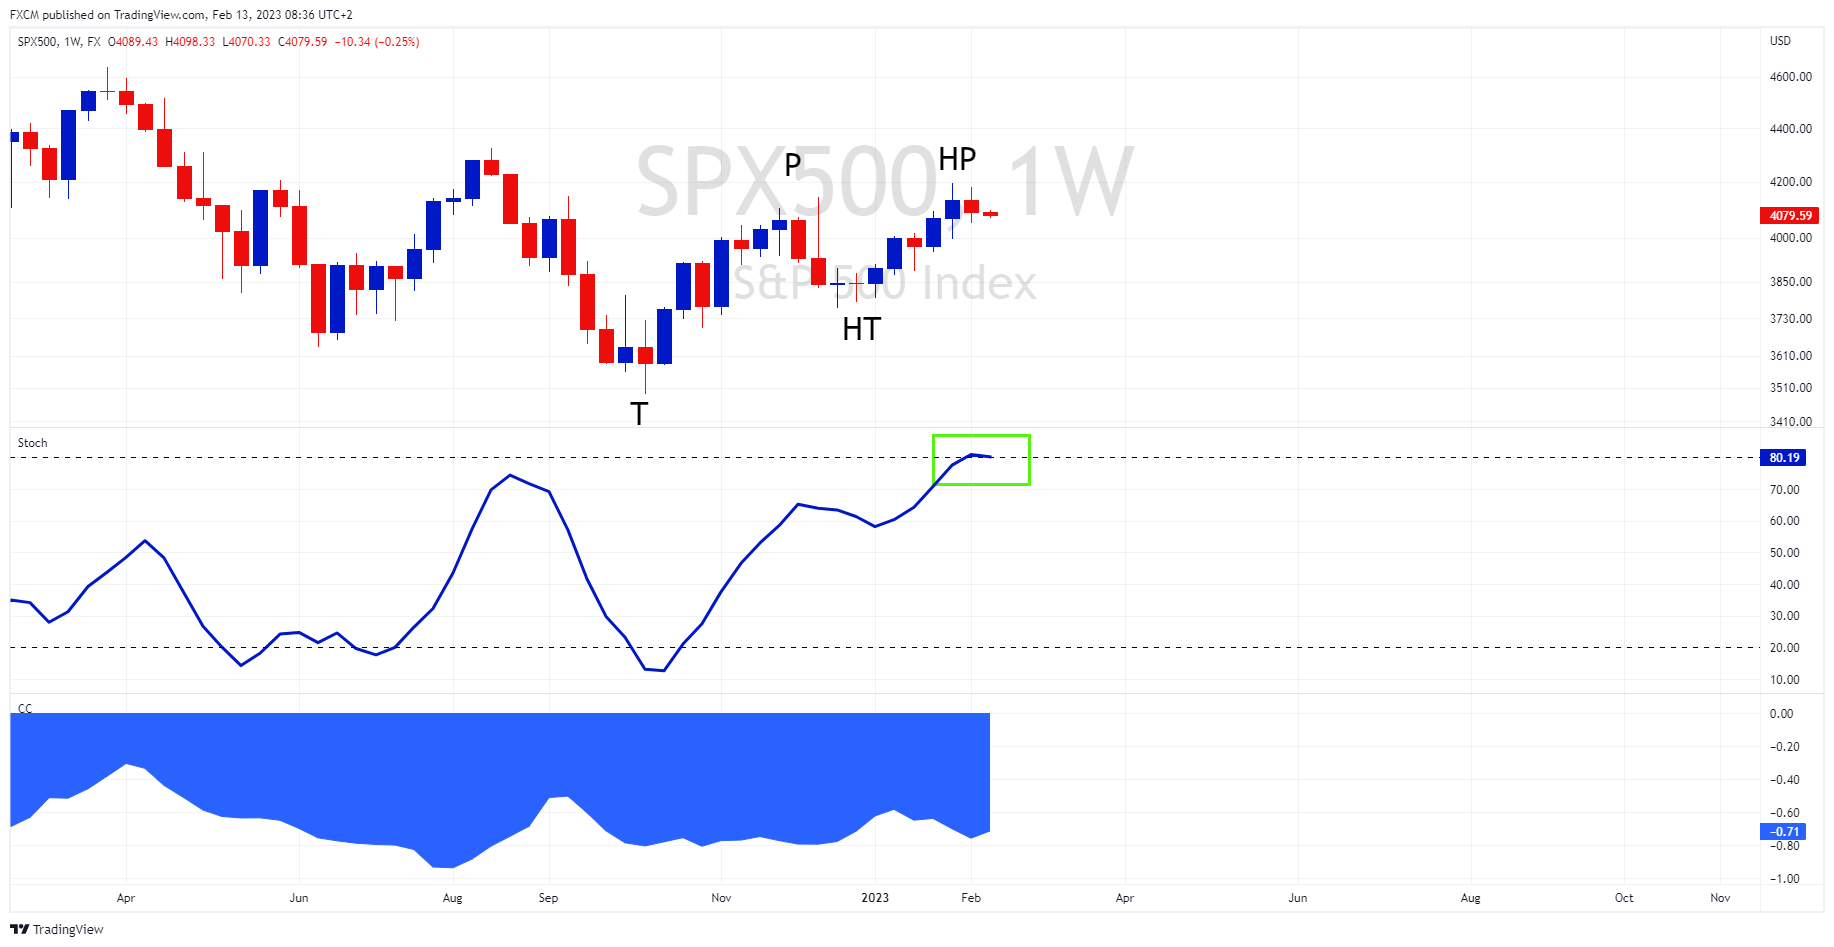
The SPX500 charted a higher trough and a higher peak on its weekly time frame. This is an uptrend. Its stochastic is in its upper quintile (green rectangle), suggesting bullish momentum. The longer time frame is meaningful; the index's primary trend is positive.
SPX500 is inversely correlated to the US 10-year real rate, with a consequential correlation coefficient (cc) of -71% (bottom indicator). All eyes are on CPI, scheduled tomorrow. It will affect the real rate and, given the sturdy cc, will also influence stocks. A downside surprise is positive for the index, but any upside will be negative.
Focus is also on expected future earnings. Market participants foresee a Fed pivot, which will benefit profits into 2024. Stock markets are forward looking and the SPX500 is discounting improvement. I.e., investors are counting on better earnings in the medium term and the recessionary pressures to bottom.
The SPX has charted its uptrend, even with current profits falling. If forecasts decline because higher rates are taking longer to transition, then headwinds will build. The position of the stochastic is important. If it loses position, momentum is waning. This will suggest a ramp up in bearish sentiment.

Russell Shor
Senior Market Specialist
Russell Shor joined FXCM in October 2017 as a Senior Market Specialist. He is a certified FMVA® and has an Honours Degree in Economics from the University of South Africa. Russell is a full member of the Society of Technical Analysts in the United Kingdom. With over 20 years of financial markets experience, his analysis is of a high standard and quality.
Any opinions, news, research, analyses, prices, other information, or links to third-party sites contained on this website are provided on an "as-is" basis, as general market commentary and do not constitute investment advice. The market commentary has not been prepared in accordance with legal requirements designed to promote the independence of investment research, and it is therefore not subject to any prohibition on dealing ahead of dissemination. Although this commentary is not produced by an independent source, FXCM takes all sufficient steps to eliminate or prevent any conflicts of interests arising out of the production and dissemination of this communication. The employees of FXCM commit to acting in the clients' best interests and represent their views without misleading, deceiving, or otherwise impairing the clients' ability to make informed investment decisions. For more information about the FXCM's internal organizational and administrative arrangements for the prevention of conflicts, please refer to the Firms' Managing Conflicts Policy. Please ensure that you read and understand our Full Disclaimer and Liability provision concerning the foregoing Information, which can be accessed here.