SPX500 moves into overbought territory, introducing possibility of a near-term pullback

Source: www.tradingview.com
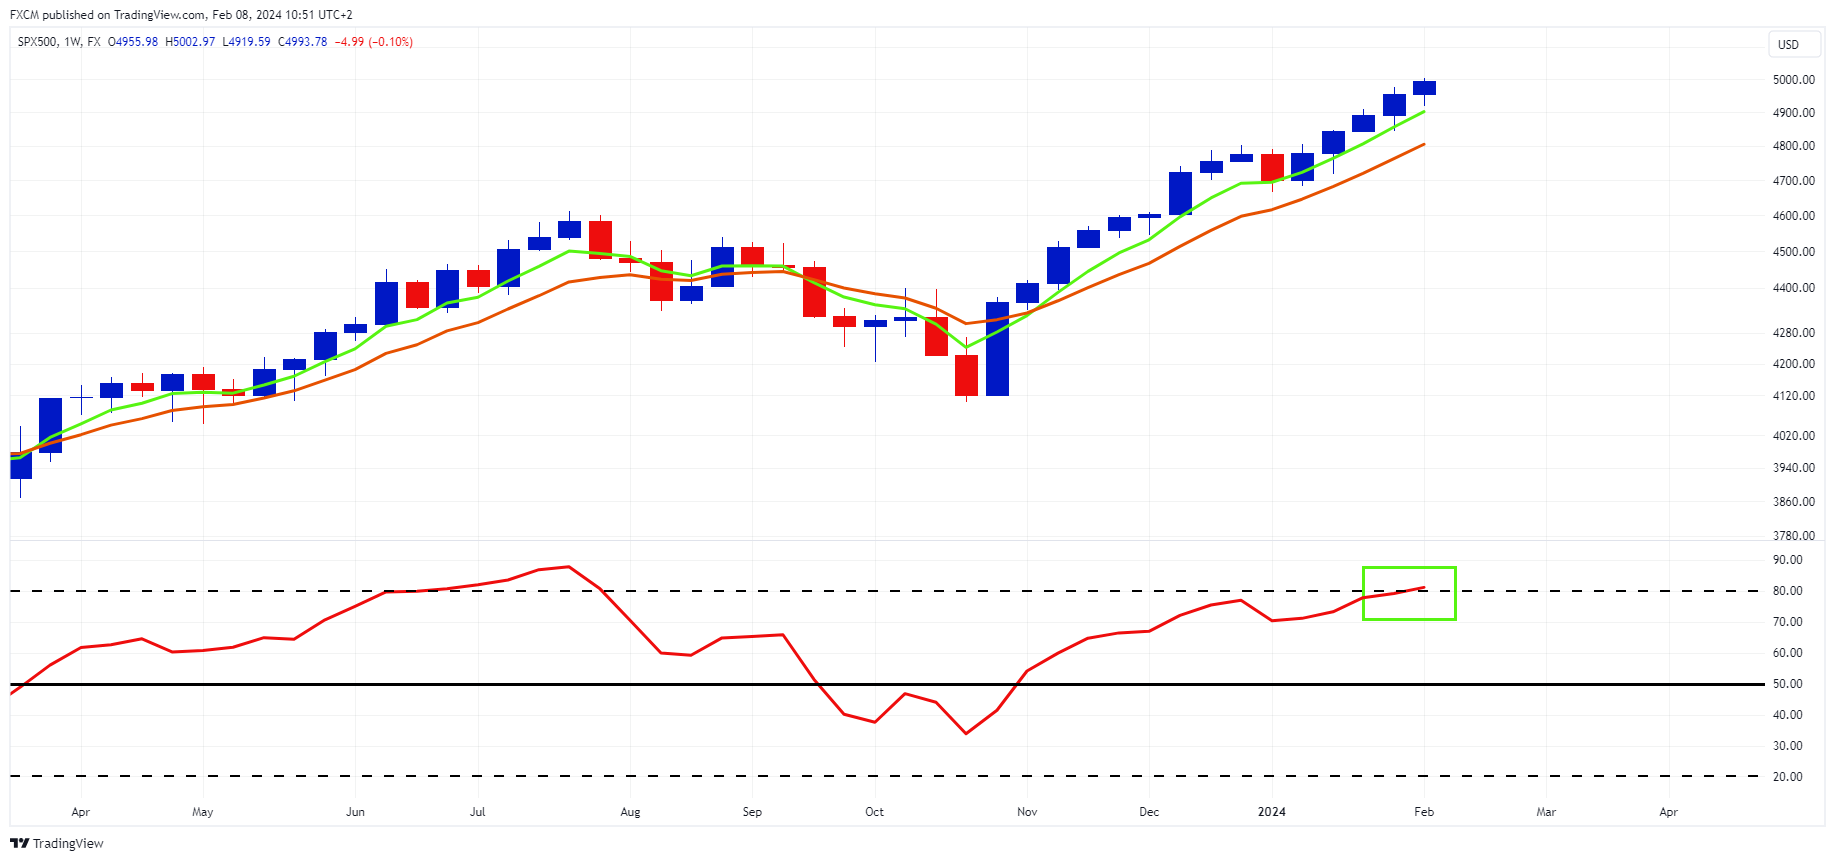
The SPX500 weekly chart has moved into overbought territory with its RSI above 80 (green rectangle). This comes as the index nears the 5,000 level. Round numbers often prove to be psychological resistance areas, and this may be the case given the index's frothy indications. I.e. a pullback over the coming weeks is a distinct possibility.
However, the underlying economy is continuing to grow, inflation is moderating, and it is likely that the Federal Reserve cuts rates in 2024. These are all mid-to-longer term supportive of the index and equities in general. The SPX500 is being driven by its largest constituents which are, in turn, being boosted by the artificial intelligence narrative. In effect these stocks may have gotten slightly ahead of themselves with profit taking due and a "buy the rumour, sell the fact" mentality dominating as we progress through earnings season.
However, the equal weighted index (not shown here), whilst not as robust as the SPX500, is also in uptrend, suggesting that there is a general underlying bullishness.
If the SPX500 pulls back and its RSI normalises, market participants may use this as an opportunity to buy back into the market at better prices.

Russell Shor
Senior Market Specialist
Russell Shor joined FXCM in October 2017 as a Senior Market Specialist. He is a certified FMVA® and has an Honours Degree in Economics from the University of South Africa. Russell is a full member of the Society of Technical Analysts in the United Kingdom. With over 20 years of financial markets experience, his analysis is of a high standard and quality.
Any opinions, news, research, analyses, prices, other information, or links to third-party sites contained on this website are provided on an "as-is" basis, as general market commentary and do not constitute investment advice. The market commentary has not been prepared in accordance with legal requirements designed to promote the independence of investment research, and it is therefore not subject to any prohibition on dealing ahead of dissemination. Although this commentary is not produced by an independent source, FXCM takes all sufficient steps to eliminate or prevent any conflicts of interests arising out of the production and dissemination of this communication. The employees of FXCM commit to acting in the clients' best interests and represent their views without misleading, deceiving, or otherwise impairing the clients' ability to make informed investment decisions. For more information about the FXCM's internal organizational and administrative arrangements for the prevention of conflicts, please refer to the Firms' Managing Conflicts Policy. Please ensure that you read and understand our Full Disclaimer and Liability provision concerning the foregoing Information, which can be accessed here.