Salesforce has been an exceptional performer in the US30 this year, with new bullish signals generating

Source: www.tradingview.com
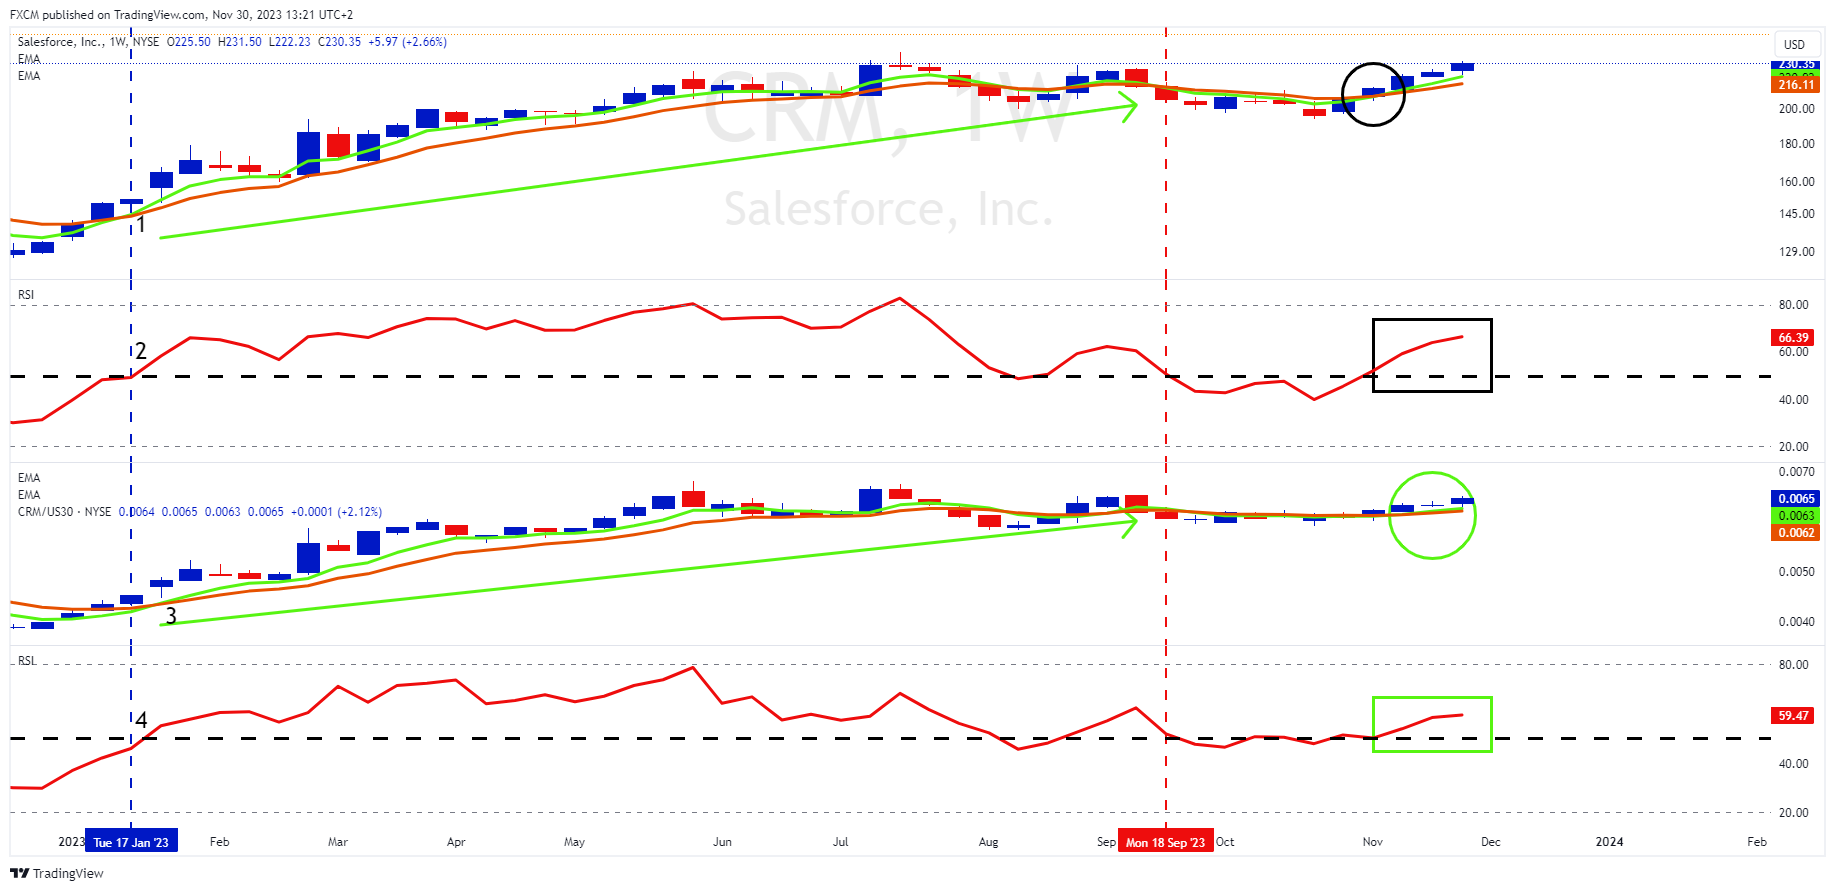
Salesforce has been the best performer in the Dow Jones Industrial Average (US30) for 2023. Its relative strength began in mid-January (blue dashed vertical). Here we see several positive technical signals:
- Its green 5-week EMA crossed above its orange 10-week EMA at 1.
- Its weekly RSI pushed above 50 at 2, denoting an underlying bullish momentum for CRM.us.
- The relative strength's green 5-week EMA crossed above its orange 10-week EMA at 3. This indicated that Salesforce had started outperforming the broader US30 index.
- The relative strength's RSI pushed above 50 at 4, signalling that Salesforce's outperformance of US30 was supported by a general momentum.
This continued until mid-September (red dashed vertical) when the indicators gave up their bullishness. However, Salesforce is now starting to show signs of outperformance again:
- Salesforce's green 5-week EMA has crossed bullishly above its orange 10-week EMA (black circle).
- The stock's RSI has pushed to the bullish side of 50 (black rectangle). The longer it maintains above 50, the greater the momentum support for its stock price.
- The relative strength's green 5-week EMA has crossed above its orange 10-week EMA (green circle). If the EMAs develop angle and separation here, CRM.us will be outperforming the US30 index.
- In this regard, the relative strength RSI has pushed above 50 (green rectangle), denoting that an underlying momentum is driving the relative strength. If this is maintained, it is likely that the relative strengths EMAs do show angle and separation.
The company's Q3 earnings did beat expectations yesterday. Adjusted profits were $2.11 per share, which compared favourably to the company forecast of $2.05-$2.06 per share and was six cents ahead of Wall Street estimates. Positively, there is a general focus on margin expansion within the compnay. CRM.us is seeing early adoption of its new data-cloud offering, with some customers testing the AI allocation features. However, it will take some time for AI to be a meaningful source of revenue.

Russell Shor
Senior Market Specialist
Russell Shor joined FXCM in October 2017 as a Senior Market Specialist. He is a certified FMVA® and has an Honours Degree in Economics from the University of South Africa. Russell is a full member of the Society of Technical Analysts in the United Kingdom. With over 20 years of financial markets experience, his analysis is of a high standard and quality.
Any opinions, news, research, analyses, prices, other information, or links to third-party sites contained on this website are provided on an "as-is" basis, as general market commentary and do not constitute investment advice. The market commentary has not been prepared in accordance with legal requirements designed to promote the independence of investment research, and it is therefore not subject to any prohibition on dealing ahead of dissemination. Although this commentary is not produced by an independent source, FXCM takes all sufficient steps to eliminate or prevent any conflicts of interests arising out of the production and dissemination of this communication. The employees of FXCM commit to acting in the clients' best interests and represent their views without misleading, deceiving, or otherwise impairing the clients' ability to make informed investment decisions. For more information about the FXCM's internal organizational and administrative arrangements for the prevention of conflicts, please refer to the Firms' Managing Conflicts Policy. Please ensure that you read and understand our Full Disclaimer and Liability provision concerning the foregoing Information, which can be accessed here.