Real yields continue to influence markets.

Introduction
The 10-year real yield, adjusted for inflation, continues to climb. It is trading close to 2% at 1.96%. The last time real yields were at these levels was back in June 2009. This post-inflation yield will be appealing to a significant number of investors, adding increased rivalry for stocks, particularly stocks with elevated valuations. The daily candles in Chart 1 show that the 10-year real yield has charted a higher trough followed by a higher peak. This puts the chart into a defined uptrend.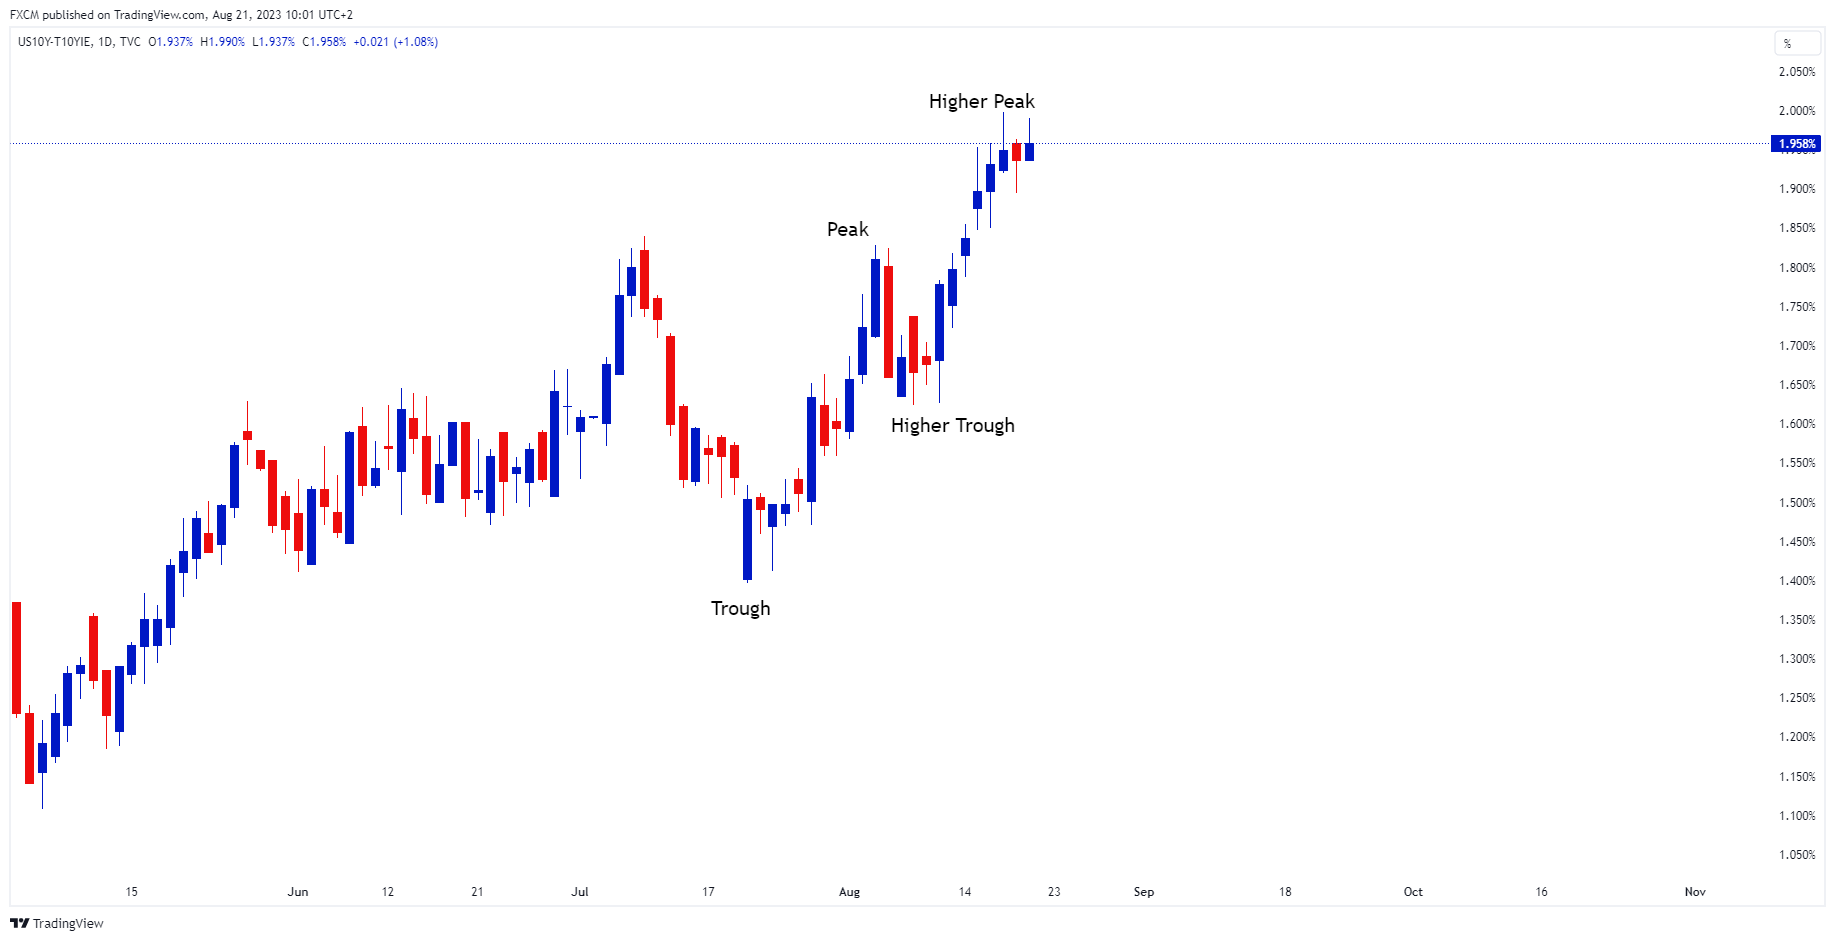
Chart 1
Source: www.tradingview.com
Real Yield and NAS100
We note that as the real yield charted a higher trough followed by a higher peak, the NAS100 charted a series of lower peaks followed by lower troughs. This puts the tech-heavy index into downtrend. In effect, the higher yields are acting as a headwind against the index, due to the NAS100's time value of money characteristics. This is represented in the correlation coefficient between the two series as seen in Chart 2, which is a robust -88%, highlighting the inverse correlation.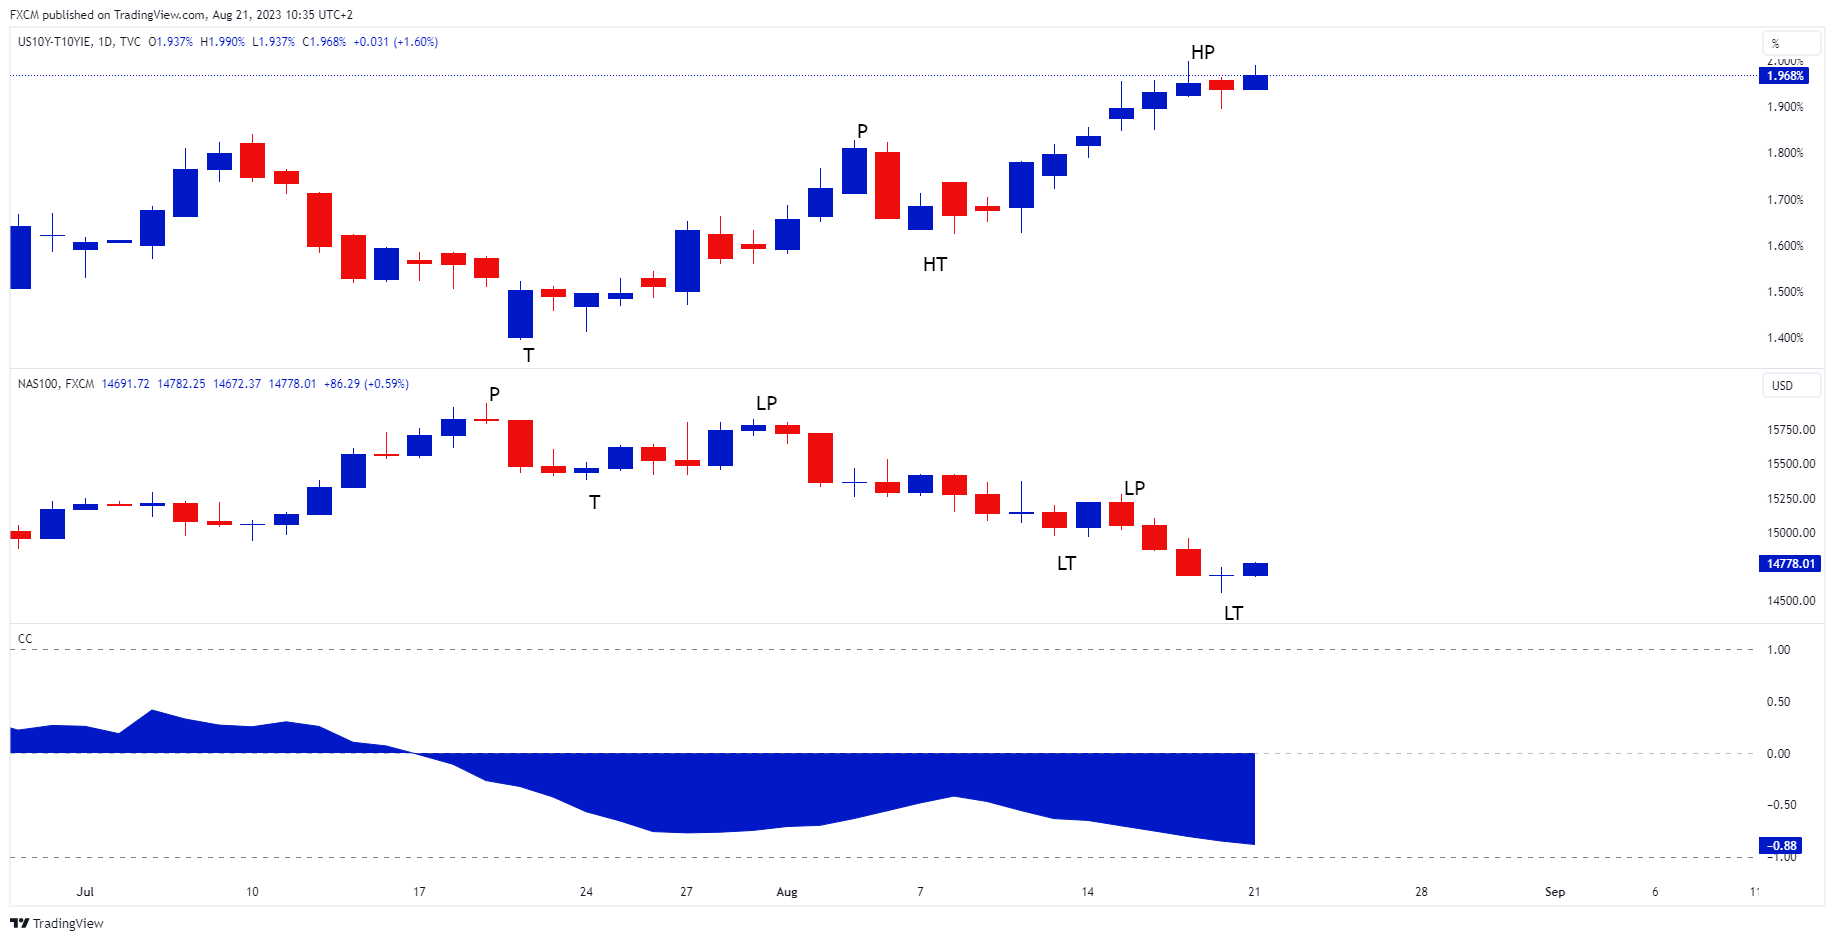
Chart 2
Source: www.tradingview.com
Real Yield and Gold
Gold analysis is similar to the NAS100 analysis. The precious metal has also charted a lower peak followed by a lower trough putting it into downtrend. This is due to the uptrend in the higher real yield. Gold does not pay a yield, therefore when competing assets such as bonds experience a higher yield, the opportunity cost of holding gold increases. This is acting as a headwind against the yellow metal. We see the correlation coefficient in chart 3 at an impressive -94%. I.e., the inverse relationship between gold and the 10-year real yield is robust in nature.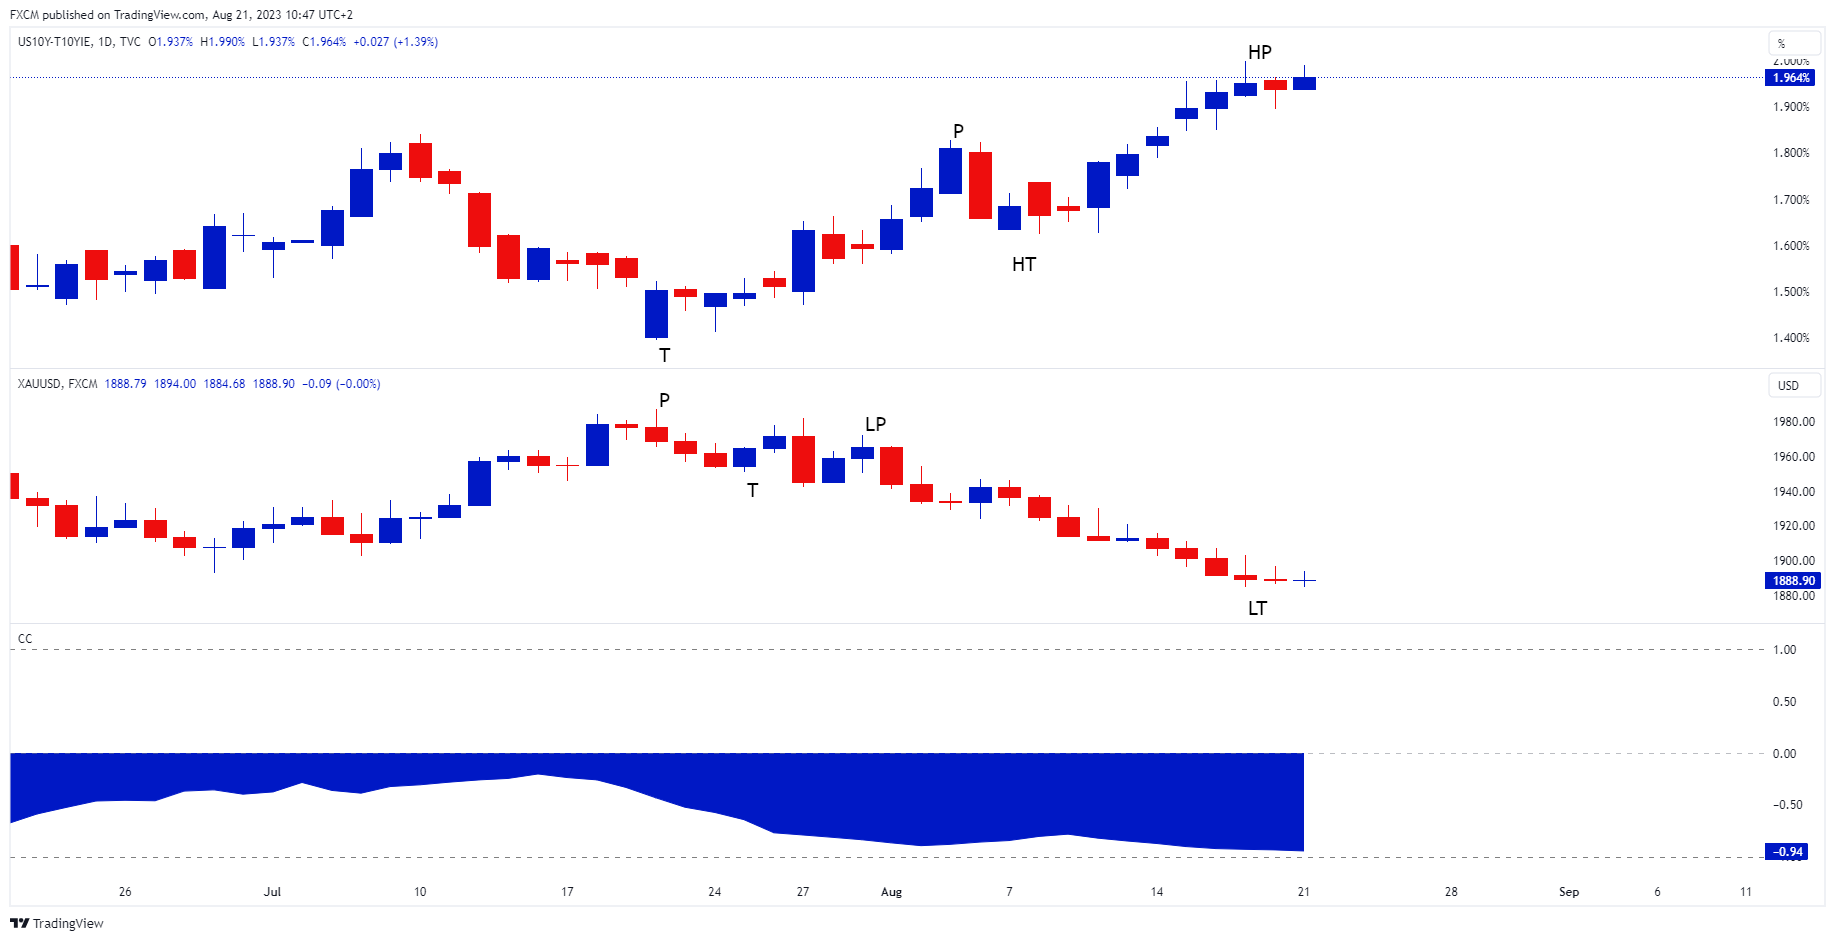
Chart 3
Source: wwww.tradingview.com
Real Yield and the USDOLLAR
As the real yield charted its uptrend, so did FXCM's USDOLLAR. The basket has charted a higher trough followed by a higher peak. I.e., the higher yield is providing support for the greenback. One of the reasons could be an indication that the Fed will hold rates higher for longer in its fight against inflation, buoying the buck. In focus will be Friday's speech from Fed Chair Jerome Powell at Jackson Hole. Currently the correlation coefficient, as per chart 4, between the real rate and the USDOLLAR is an impressive 94%, highlighting the positive relationship between the two.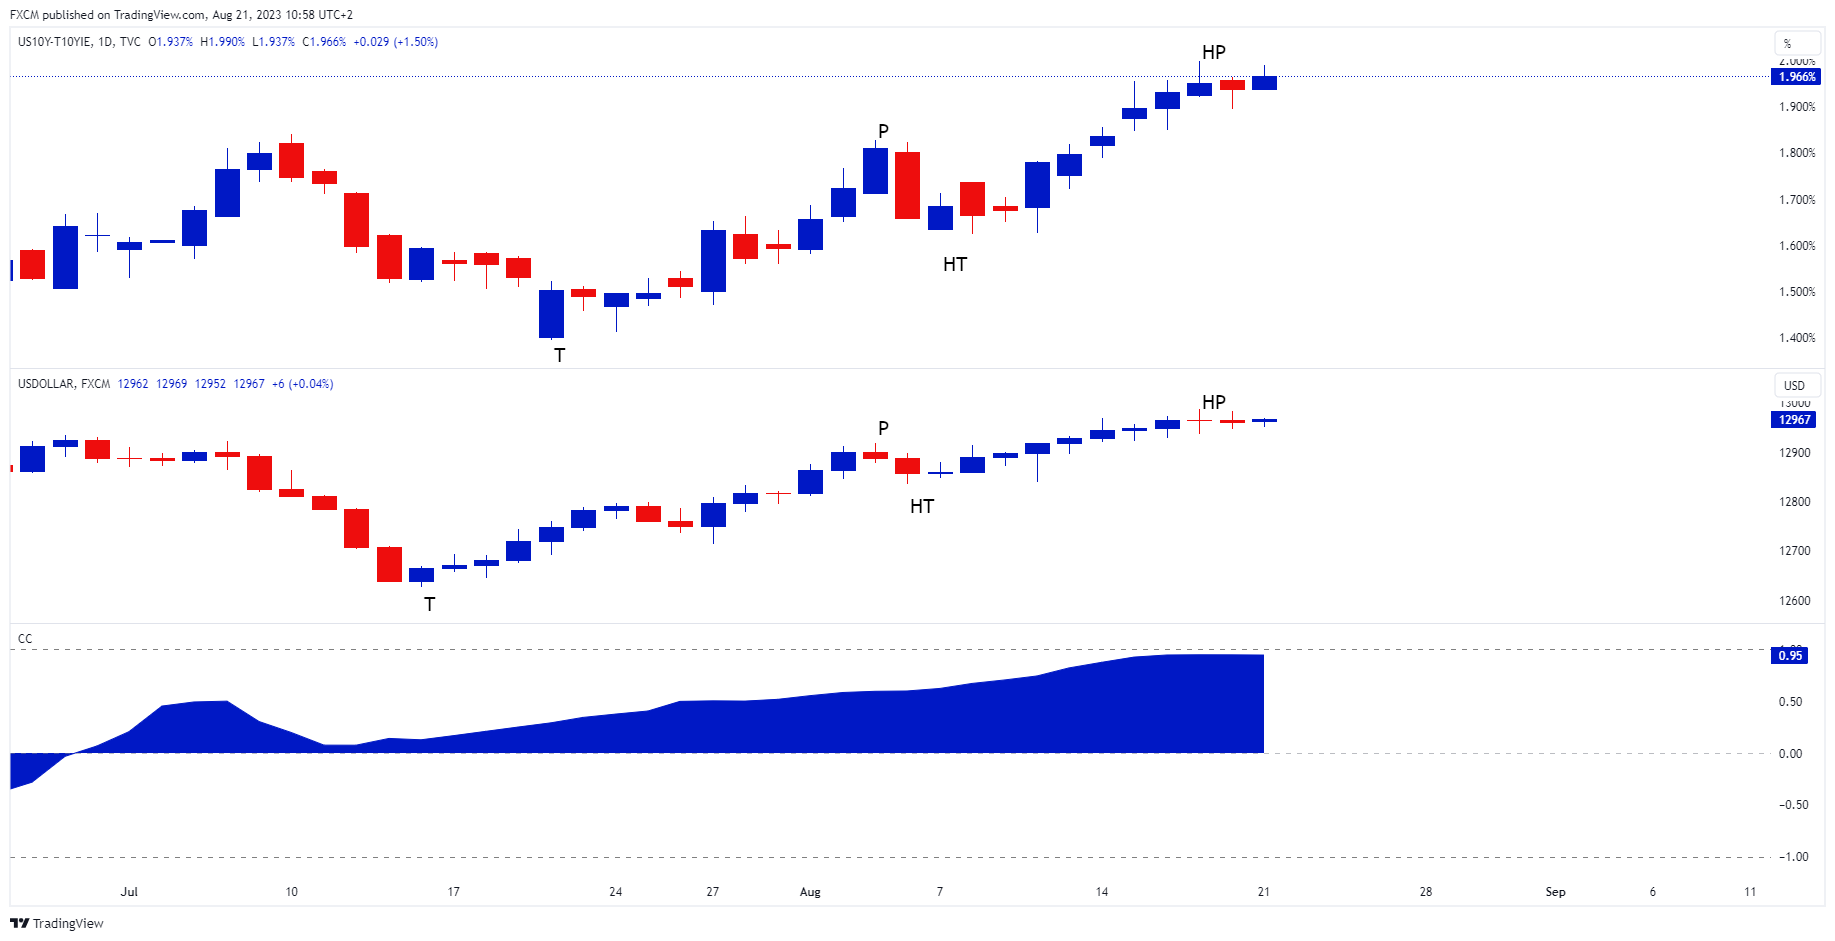
Chart 4
Source: www.tradingview.com
Conclusion
The real yield is trending up. This is having all sort of intermarket effects. It is acting against risk assets like the NAS100, as well as hurting gold. However, the real yield is supportive of the USDOLLAR. The direction of the real yield will continue to have these intermarket effects. As such, it is important to continue to monitor the US fixed income market as it is a key cog in the market's chain of causality.

Russell Shor
Senior Market Specialist
Russell Shor joined FXCM in October 2017 as a Senior Market Specialist. He is a certified FMVA® and has an Honours Degree in Economics from the University of South Africa. Russell is a full member of the Society of Technical Analysts in the United Kingdom. With over 20 years of financial markets experience, his analysis is of a high standard and quality.
Any opinions, news, research, analyses, prices, other information, or links to third-party sites contained on this website are provided on an "as-is" basis, as general market commentary and do not constitute investment advice. The market commentary has not been prepared in accordance with legal requirements designed to promote the independence of investment research, and it is therefore not subject to any prohibition on dealing ahead of dissemination. Although this commentary is not produced by an independent source, FXCM takes all sufficient steps to eliminate or prevent any conflicts of interests arising out of the production and dissemination of this communication. The employees of FXCM commit to acting in the clients' best interests and represent their views without misleading, deceiving, or otherwise impairing the clients' ability to make informed investment decisions. For more information about the FXCM's internal organizational and administrative arrangements for the prevention of conflicts, please refer to the Firms' Managing Conflicts Policy. Please ensure that you read and understand our Full Disclaimer and Liability provision concerning the foregoing Information, which can be accessed here.