The real yield is acting as an influence on SPX500, and may be volatile in the near-term

Source: www.tradingview.com
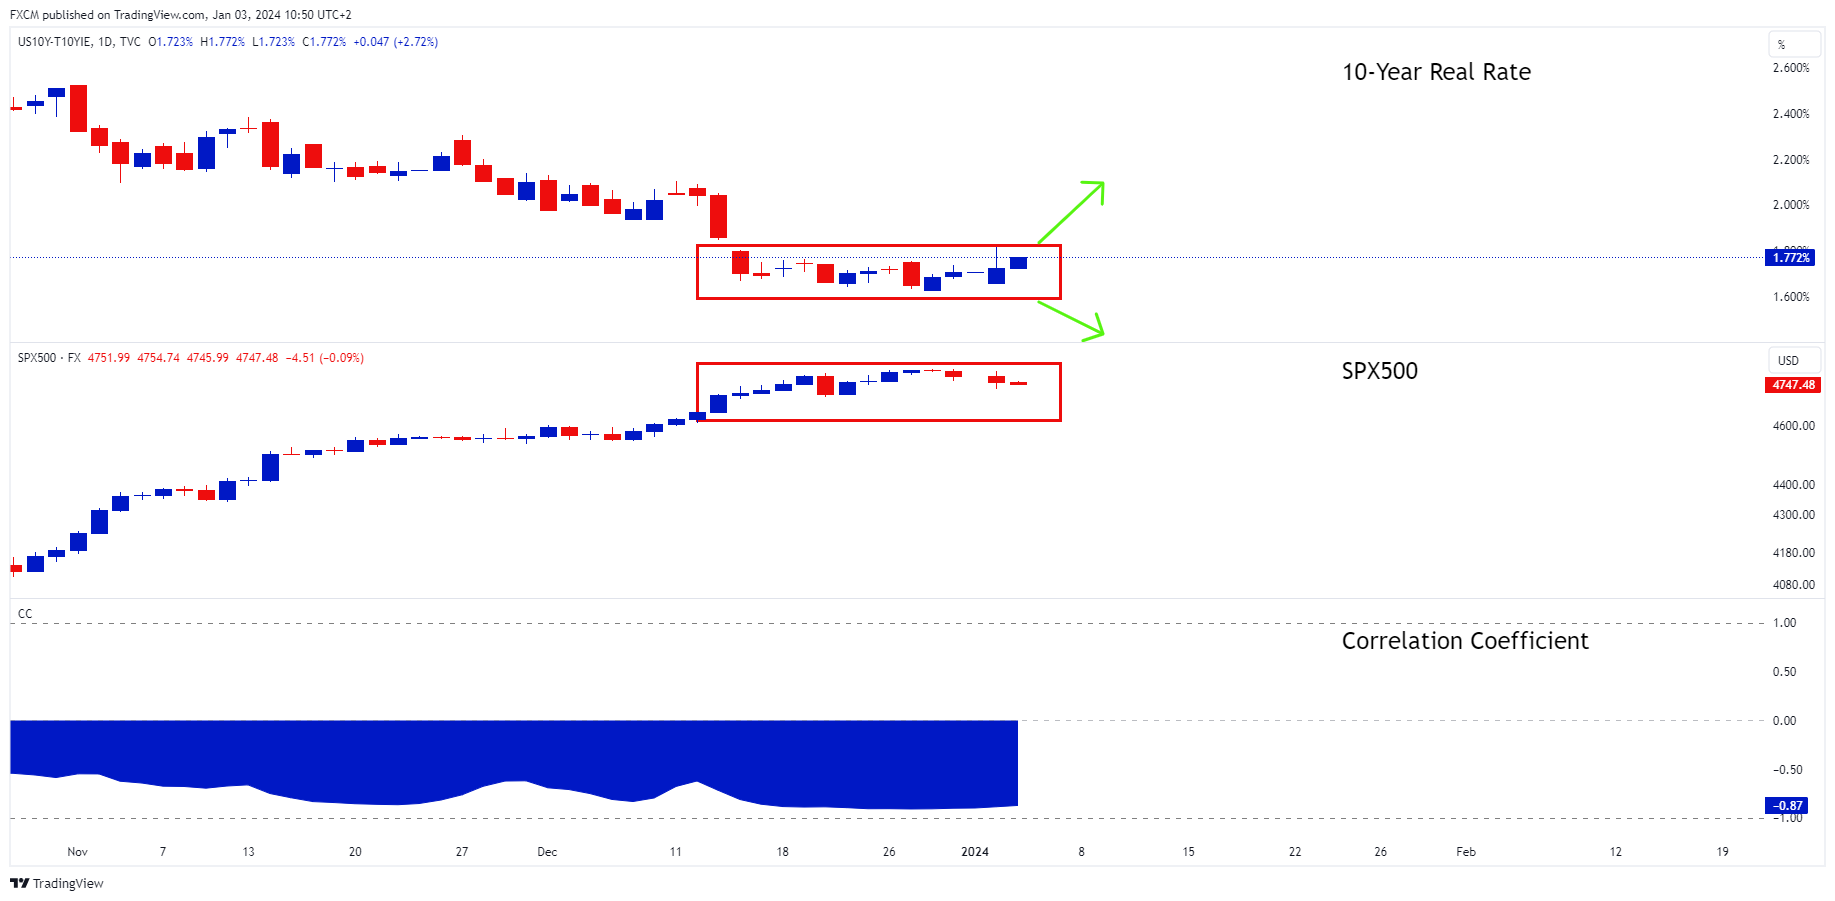
There is a relationship between the 10-year real rate and the SPX500. The correlation coefficient between the two is a robust -87%. I.e. they generally travel together but in opposite directions. This makes sense given the time value of money of the SPX500, where a lower real rate will tend to support the stock market.
The real rate has declined since its high of 2.61% for October 2023. This, in turn, has seen an appreciation in the SPX500 over the period. However, since the middle of December, the yield has levelled off (top red rectangle) and as such, the SPX500 has lost its momentum, and is tending to drift sideways, with only a slight upwards appreciation (bottom red rectangle).
Our opinion, and subject to correction, is that in the medium-to-longer term, the path of least resistance is down for the real rate, thereby supporting the SPX500. This is because inflation is moderating, and the Fed will likely cut rates this year.
However, in the short-term the direction may be more volatile.
Considering the real yield, the directional breakout from the top red rectangle (green arrows) will have an influence on the SPX500, given the strong correlation coefficient between the two. I.e. a higher yield will likely act as a headwind against the SPX500, whilst a breakdown in the yield will help support the stock index.

Russell Shor
Senior Market Specialist
Russell Shor joined FXCM in October 2017 as a Senior Market Specialist. He is a certified FMVA® and has an Honours Degree in Economics from the University of South Africa. Russell is a full member of the Society of Technical Analysts in the United Kingdom. With over 20 years of financial markets experience, his analysis is of a high standard and quality.
Any opinions, news, research, analyses, prices, other information, or links to third-party sites contained on this website are provided on an "as-is" basis, as general market commentary and do not constitute investment advice. The market commentary has not been prepared in accordance with legal requirements designed to promote the independence of investment research, and it is therefore not subject to any prohibition on dealing ahead of dissemination. Although this commentary is not produced by an independent source, FXCM takes all sufficient steps to eliminate or prevent any conflicts of interests arising out of the production and dissemination of this communication. The employees of FXCM commit to acting in the clients' best interests and represent their views without misleading, deceiving, or otherwise impairing the clients' ability to make informed investment decisions. For more information about the FXCM's internal organizational and administrative arrangements for the prevention of conflicts, please refer to the Firms' Managing Conflicts Policy. Please ensure that you read and understand our Full Disclaimer and Liability provision concerning the foregoing Information, which can be accessed here.