Real Yield Boosts USDOLLAR Today but Weekly Signal Suggest a Possible Apex to FOMC Hiking Cycle
Daily Chart
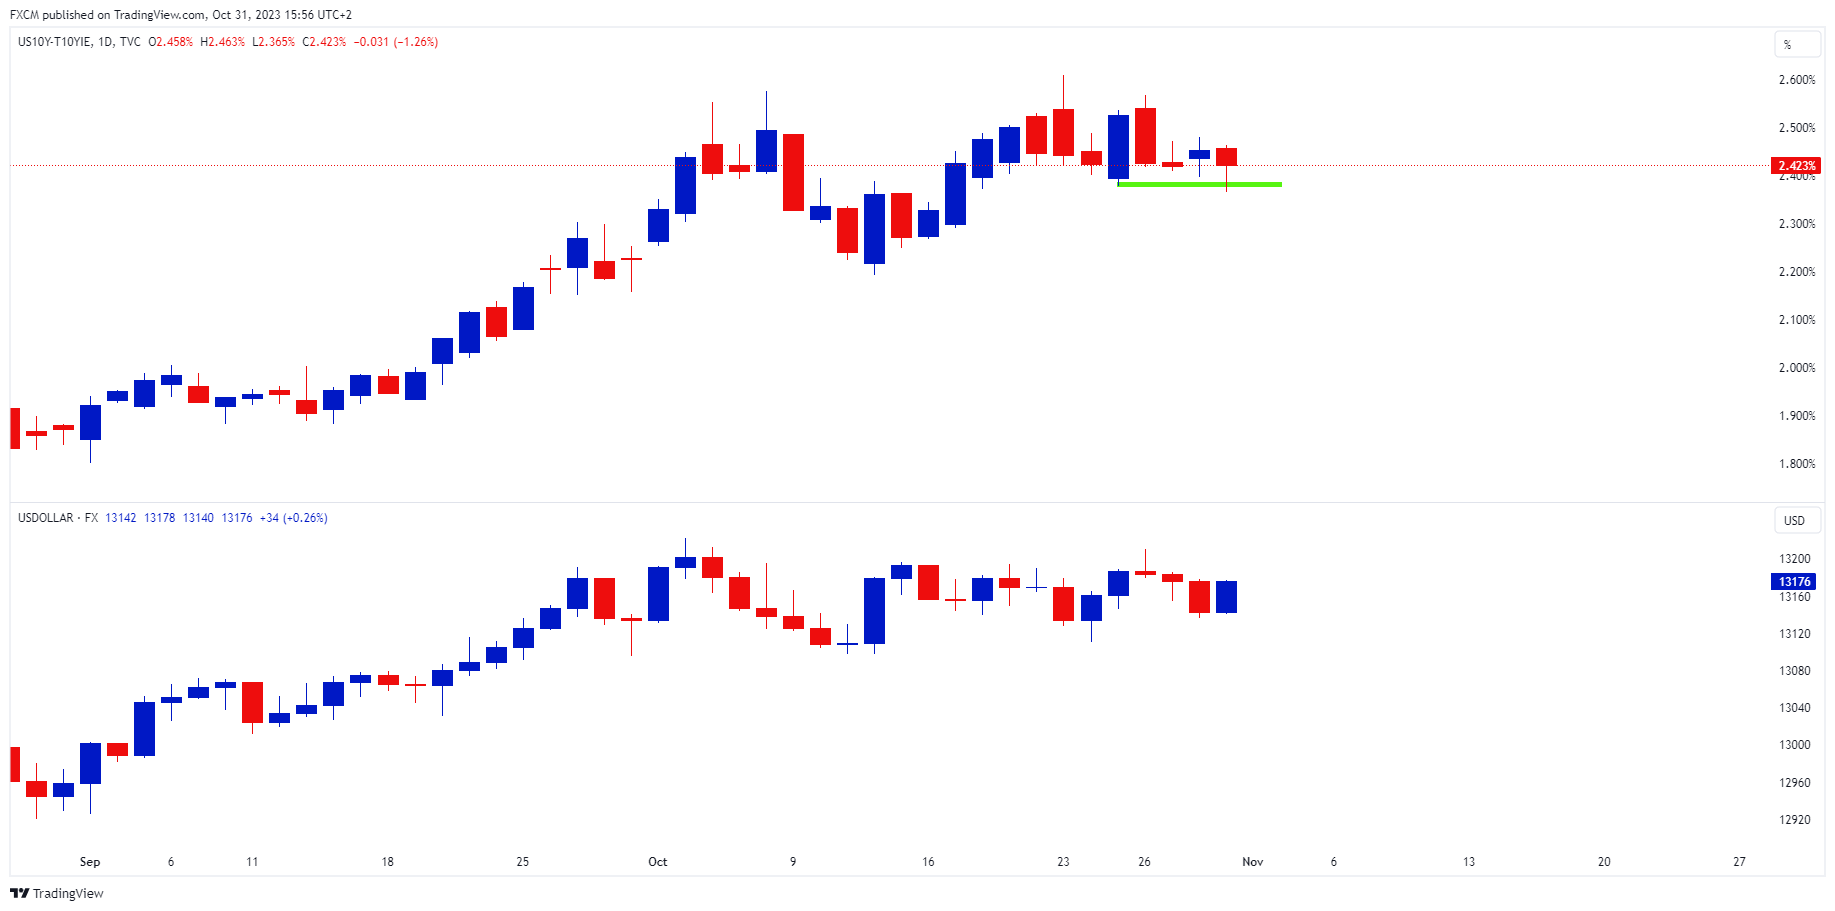
Source: www.tradingview.com
The real yield has found support at the 2.36% level (green horizontal line), with the ECI coming in at 1.1%. This, in turn, has seen a bid emerge for FXCM's USDOLLAR, which is up 0.26% today. However, market participants are looking ahead at the FOMC Statement at 6:00pm (GMT) tomorrow. The CME FedWatch Tool has the probability at 97% that rates will be held steady at the current target rate of 525-550. The market is looking to see if the Federal Reserve is effectively done with its rate hiking cycle.
A dovish tilt will likely see real rates decline, which in turn will pressure FXCM's USDOLLAR basket. An interesting potential technical signal on the weekly chart does seem to suggest that we are near the apex of the Federal Reserve's current hiking cycle.
RSI Failure Swing
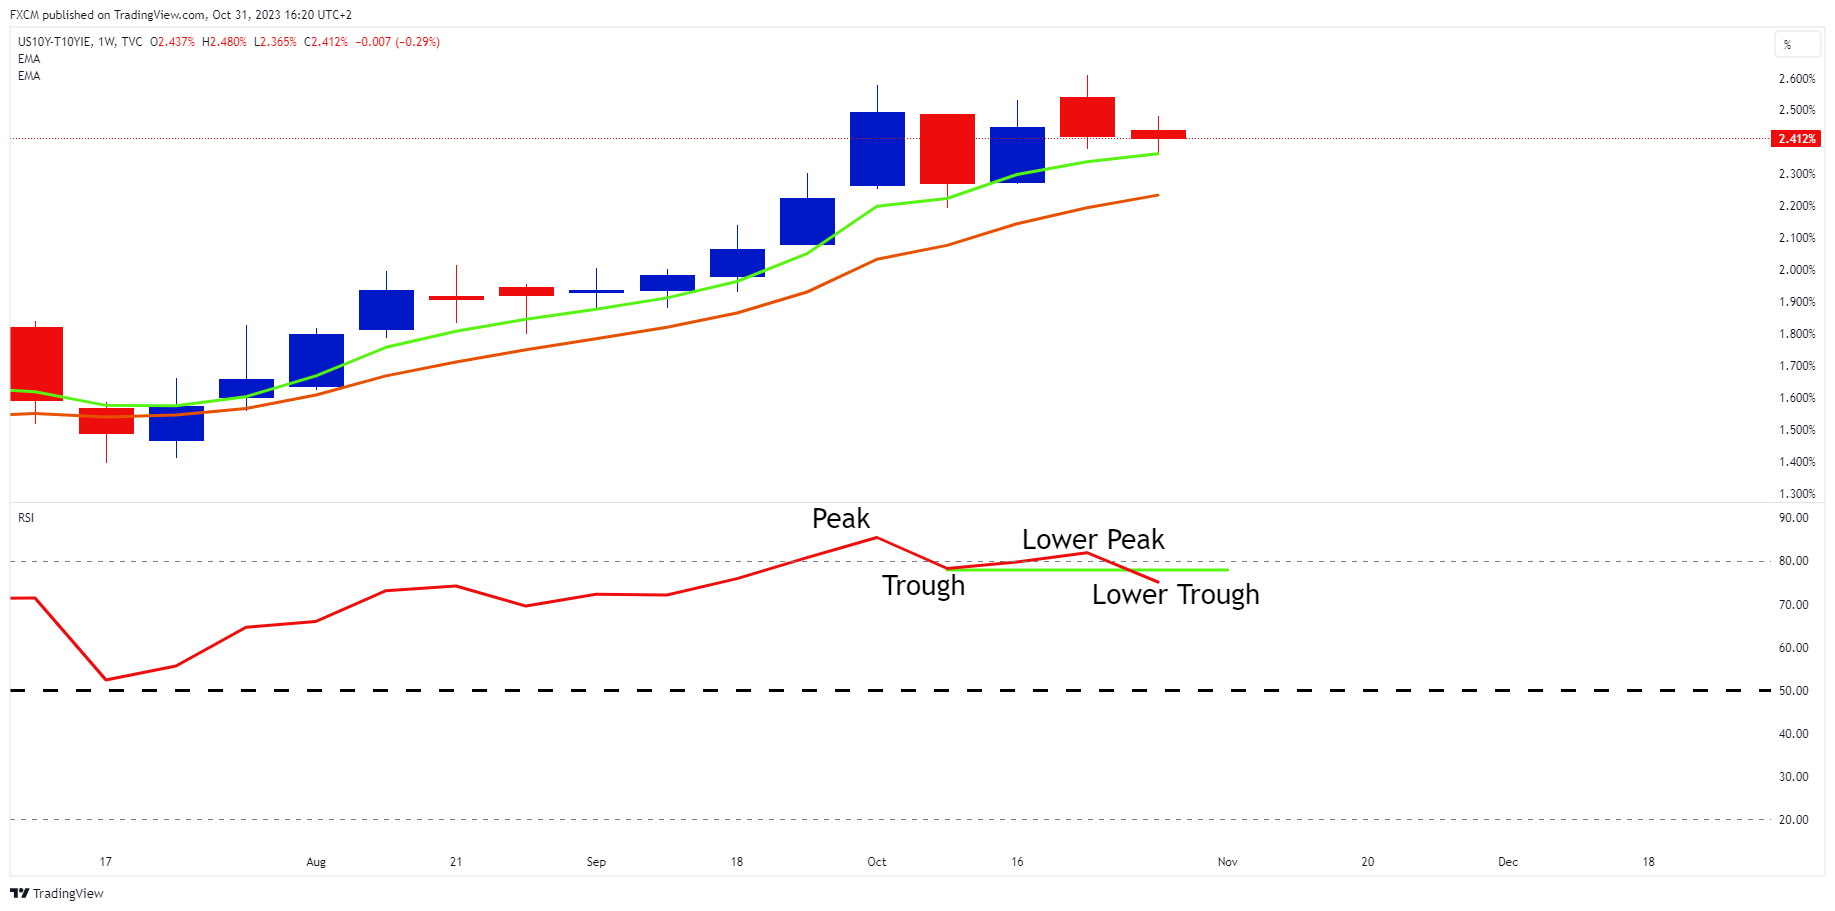
Source: www.tradingview.com
A failure swing after an RSI peak in overbought territory is a strong indication of a reversal. A failure swing is a trend reversal on the RSI, identified via peak and trough analysis. Above, the RSI has charted a lower peak followed by a lower trough at its overbought level. It's important to note that failure swings are not used in isolation. In this case a bearish cross of the real yield's EMAs will add weight to the failure swing signal.
Comment
Whether the failure swing results in something more substantial like the EMA bearish cross remains to be seen. However, if the Federal Reserve's forward guidance is inherently dovish, it is likely that the real rate retreats. This is turn will have intermarket effects. E.g., a rally in risk assets such as stocks is likely to follow. Treasuries and gold would bounce as yields decline and FXCM's USDOLLAR basket will likely fall as well.

Russell Shor
Senior Market Specialist
Russell Shor joined FXCM in October 2017 as a Senior Market Specialist. He is a certified FMVA® and has an Honours Degree in Economics from the University of South Africa. Russell is a full member of the Society of Technical Analysts in the United Kingdom. With over 20 years of financial markets experience, his analysis is of a high standard and quality.
Any opinions, news, research, analyses, prices, other information, or links to third-party sites contained on this website are provided on an "as-is" basis, as general market commentary and do not constitute investment advice. The market commentary has not been prepared in accordance with legal requirements designed to promote the independence of investment research, and it is therefore not subject to any prohibition on dealing ahead of dissemination. Although this commentary is not produced by an independent source, FXCM takes all sufficient steps to eliminate or prevent any conflicts of interests arising out of the production and dissemination of this communication. The employees of FXCM commit to acting in the clients' best interests and represent their views without misleading, deceiving, or otherwise impairing the clients' ability to make informed investment decisions. For more information about the FXCM's internal organizational and administrative arrangements for the prevention of conflicts, please refer to the Firms' Managing Conflicts Policy. Please ensure that you read and understand our Full Disclaimer and Liability provision concerning the foregoing Information, which can be accessed here.