NAS100 Rebounds from an Ugly Week as the Fed & Apple Loom

Risk Factors
It was an ugly week for Wall Street as investors tracked a series of developments and the most recent economic data, which support the Fed's higher-for-longer narrative. The US economy grew by 4.9% in Q3 according to Thursday's preliminary release, which is the fastest pace in almost a year. Headline PCE inflation steadied at 3.4% y/y in August, while core eased only marginally to 3.7% y/y. At the same time, treasury yields remain elevated, despite some containment. The US 10-yield pulled back last week, but not before setting new multi-year highs.
Markets also monitor the situation in the Middle East, where the conflict escalates. Israel has begun a ground assault into the Gaza Strip, entering the second phase of the war, which PM Netanyahu said will be "long and difficult". [1]
Mixed Earnings
Tech giants reported somewhat mixed results last week that failed to inspire NAS100 against this heavy backdrop. Amazon's net profits more than tripled from a year a year ago, revenues grew 11% with projection for record highs in Q4 and the cloud business showed signs of stabilization, sending the stock up nearly 7% on Friday. Meta Platforms posted record top and bottom lines on AI progress and higher advertising revenue, but the warning for softer ad spending in the current quarter was not well received and the stock dropped.
Microsoft's financials improved in the third quarter as it begins monetizing on its artificial intelligence advances and the stock jumped right after the results, but gave up the gains, partly due to timid forward guidance. Alphabet underwhelmed with its AI progress and the slowdown in its cloud business, sending GOOG.us to roughly 10% losses last week.
Focus now shifts to Apple, which undergoes a challenging period ahead of Thursday's quarterly report.
NAS100 Analysis
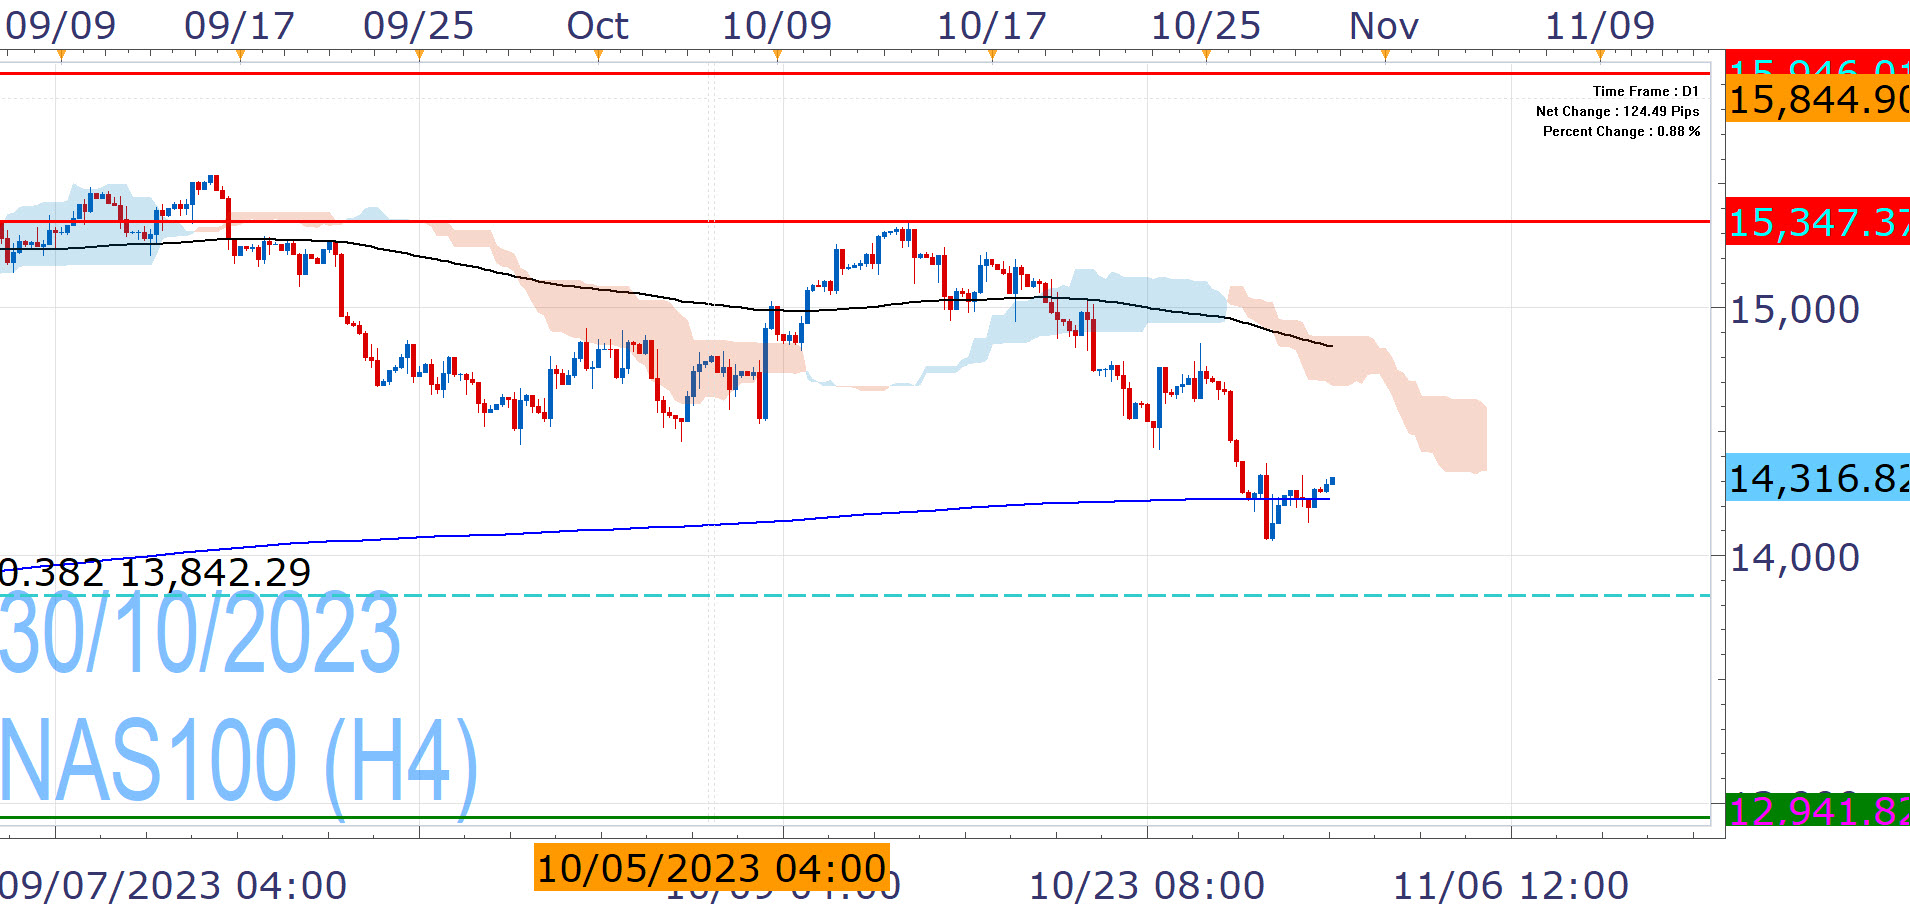
NAS100 continued its three-month decline and ended last week in correction territory, as it lost more than 10% from July's 2023 highs. It breached the 200Days EMA (blue line) which exposes it to the critical 38.2% Fibonacci of the 2022 low/2023 high rally, but we are still cautious for sustained weakness towards 12,941.
Despite last week's poor performance, NAS100 rises since Friday, as sentiment shows improvement. Above the 38.2% Fibonacci, the slide is viewed as a limited correction and the index has the chance to push towards the EMA200 (at around 14,850) and bring 15,347 in its crosshairs. However, it will need a catalyst for that, as the upside looks unfriendly with a thick falling daily Ichimoku Cloud.
Markets now await the Fed's pivotal rate decision on Wednesday, which will likely determine the trajectory of NAS100. Markets expect a hold and believe that rates have already peaked, while there were some dovish remarks recently, but the strong economy and tight labor market keep more tightening in play. Any insights on the next steps will be the key focal point.

Nikos Tzabouras
Senior Financial Editorial Writer
Nikos Tzabouras is a graduate of the Department of International & European Economic Studies at the Athens University of Economics and Business. He has a long time presence at FXCM, as he joined the company in 2011. He has served from multiple positions, but specializes in financial market analysis and commentary.
With his educational background in international relations, he emphasizes not only on Technical Analysis but also in Fundamental Analysis and Geopolitics – which have been having increasing impact on financial markets. He has longtime experience in market analysis and as a host of educational trading courses via online and in-person sessions and conferences.
References
| Retrieved 27 Apr 2024 https://www.gov.il/en/departments/news/event-statement281023 |
Any opinions, news, research, analyses, prices, other information, or links to third-party sites contained on this website are provided on an "as-is" basis, as general market commentary and do not constitute investment advice. The market commentary has not been prepared in accordance with legal requirements designed to promote the independence of investment research, and it is therefore not subject to any prohibition on dealing ahead of dissemination. Although this commentary is not produced by an independent source, FXCM takes all sufficient steps to eliminate or prevent any conflicts of interests arising out of the production and dissemination of this communication. The employees of FXCM commit to acting in the clients' best interests and represent their views without misleading, deceiving, or otherwise impairing the clients' ability to make informed investment decisions. For more information about the FXCM's internal organizational and administrative arrangements for the prevention of conflicts, please refer to the Firms' Managing Conflicts Policy. Please ensure that you read and understand our Full Disclaimer and Liability provision concerning the foregoing Information, which can be accessed here.