NAS100 Moves into Downtrend on Weekly Timeframe

Weekly Chart Analysis
.png)
Similar to yesterday's article, the NAS100 is also showing worrying signs of technical weakness. Like the SPX500, the NAS100 has charted a lower peak followed by a lower trough. This puts the growth index into a defined downtrend. Its weekly RSI has also dipped below 50, which is on the bearish side of the indicator. If it maintains below 50 for an extended period, the NAS100 will be under pressure.
The next level of support that we are watching is the black 30-week EMA. If the NAS100 candlesticks cross below the 30-week EMA, and the EMA turns down this will be regarded as a further bearish development.
The downtrend's momentum may also be monitored with reference to the candlesticks and the down sloping black trendline. If the index can push above it, the downtrend's momentum will be waning. However, if the black trendline's gradient steepens, the downtrend will be accelerating.
High Yields are Pressuring the NAS100
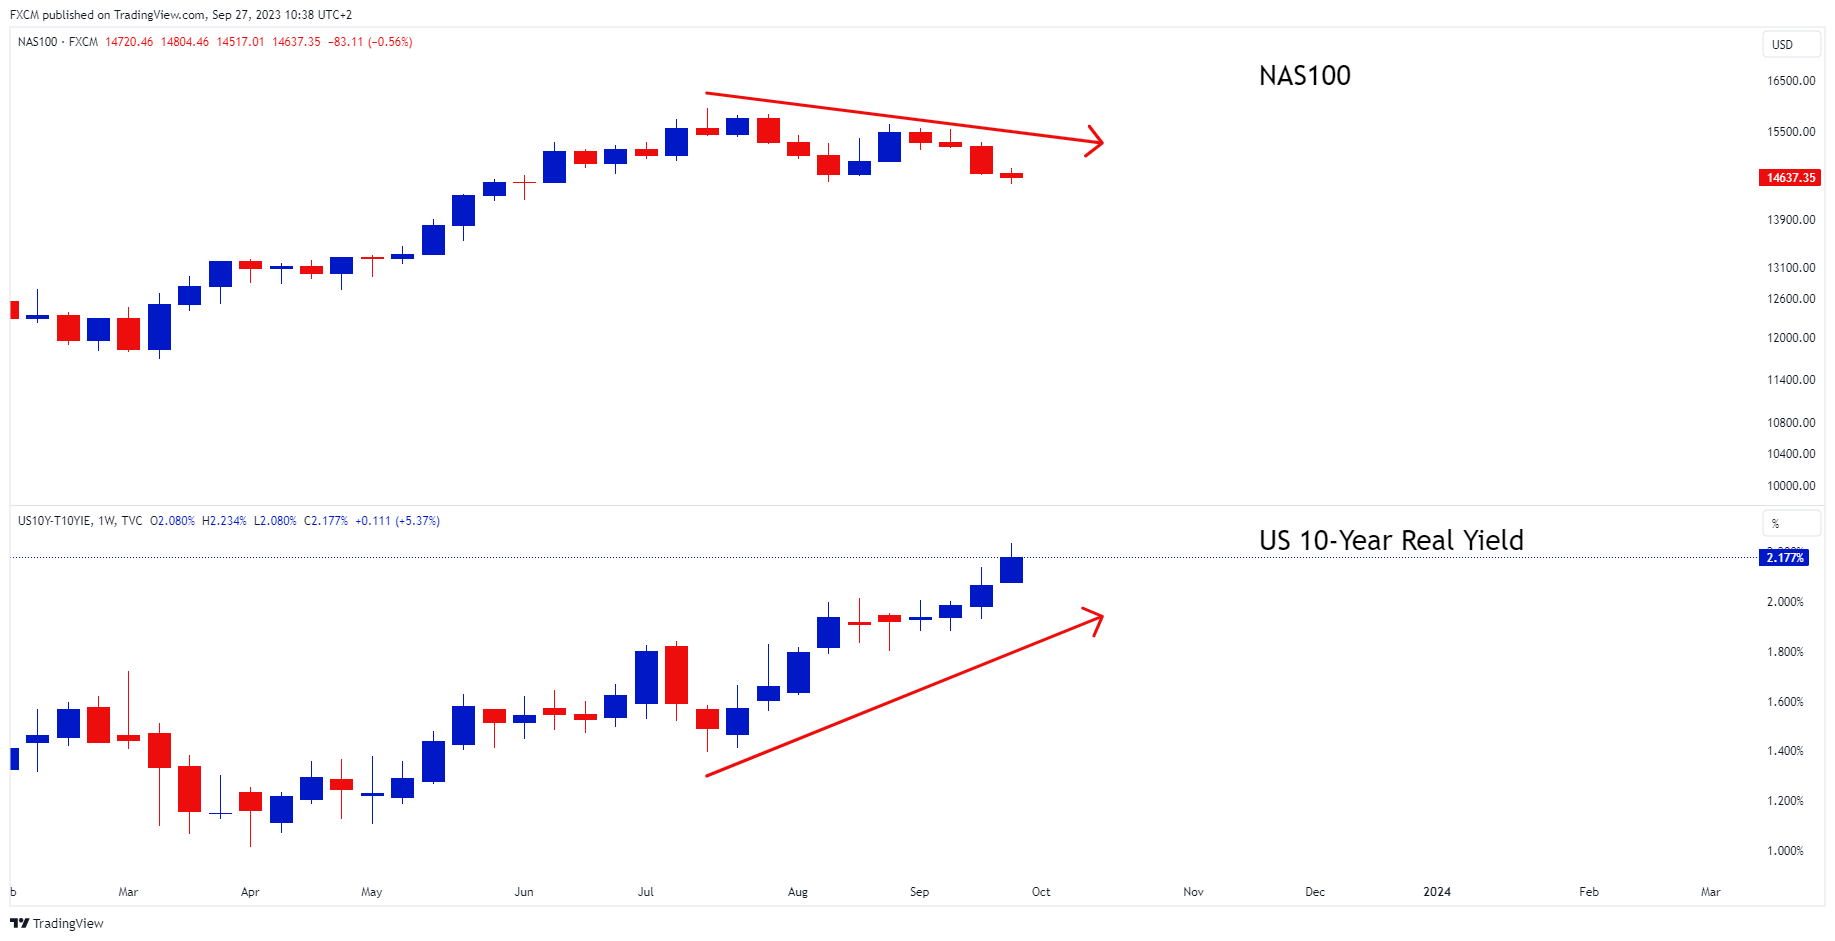
Source: www.tradingview.com
It is not surprising that the NAS100 has come under pressure. The downtrend coincides with much higher US 10-year real yields. Since Monday 17 July (the week of the NAS100's reference peak), until this week (the completion of the NAS100's lower trough), the real yield has appreciated by around 45%, and is currently at 2.175%.
The NAS100 is a growth index, which means that its is particularly sensitive to yields, as per its time value of money characteristics. The question now is just how high yields can rise. The higher they go the more pressure will be applied to the NAS100.
We have previously seen that the real yield is overbought. If this results in a pullback in the yield, the NAS100 is likely to benefit. However, this still remains to be seen.

Russell Shor
Senior Market Specialist
Russell Shor joined FXCM in October 2017 as a Senior Market Specialist. He is a certified FMVA® and has an Honours Degree in Economics from the University of South Africa. Russell is a full member of the Society of Technical Analysts in the United Kingdom. With over 20 years of financial markets experience, his analysis is of a high standard and quality.
Any opinions, news, research, analyses, prices, other information, or links to third-party sites contained on this website are provided on an "as-is" basis, as general market commentary and do not constitute investment advice. The market commentary has not been prepared in accordance with legal requirements designed to promote the independence of investment research, and it is therefore not subject to any prohibition on dealing ahead of dissemination. Although this commentary is not produced by an independent source, FXCM takes all sufficient steps to eliminate or prevent any conflicts of interests arising out of the production and dissemination of this communication. The employees of FXCM commit to acting in the clients' best interests and represent their views without misleading, deceiving, or otherwise impairing the clients' ability to make informed investment decisions. For more information about the FXCM's internal organizational and administrative arrangements for the prevention of conflicts, please refer to the Firms' Managing Conflicts Policy. Please ensure that you read and understand our Full Disclaimer and Liability provision concerning the foregoing Information, which can be accessed here.