NAS100 Charts Consolidation Pattern on Weekly Timeframe

Weekly Consolidation Pattern
.png)
In a previous article we suggested that the NAS100 had a downtrend bias to it. Price action has evolved to a point where it seems that a descending triangle (green trendlines) has charted on the weekly time frame. Assuming this to be the case, a breakout or breakdown from the pattern will have bullish or bearish implications.
Real Rate/NAS100 Relationship
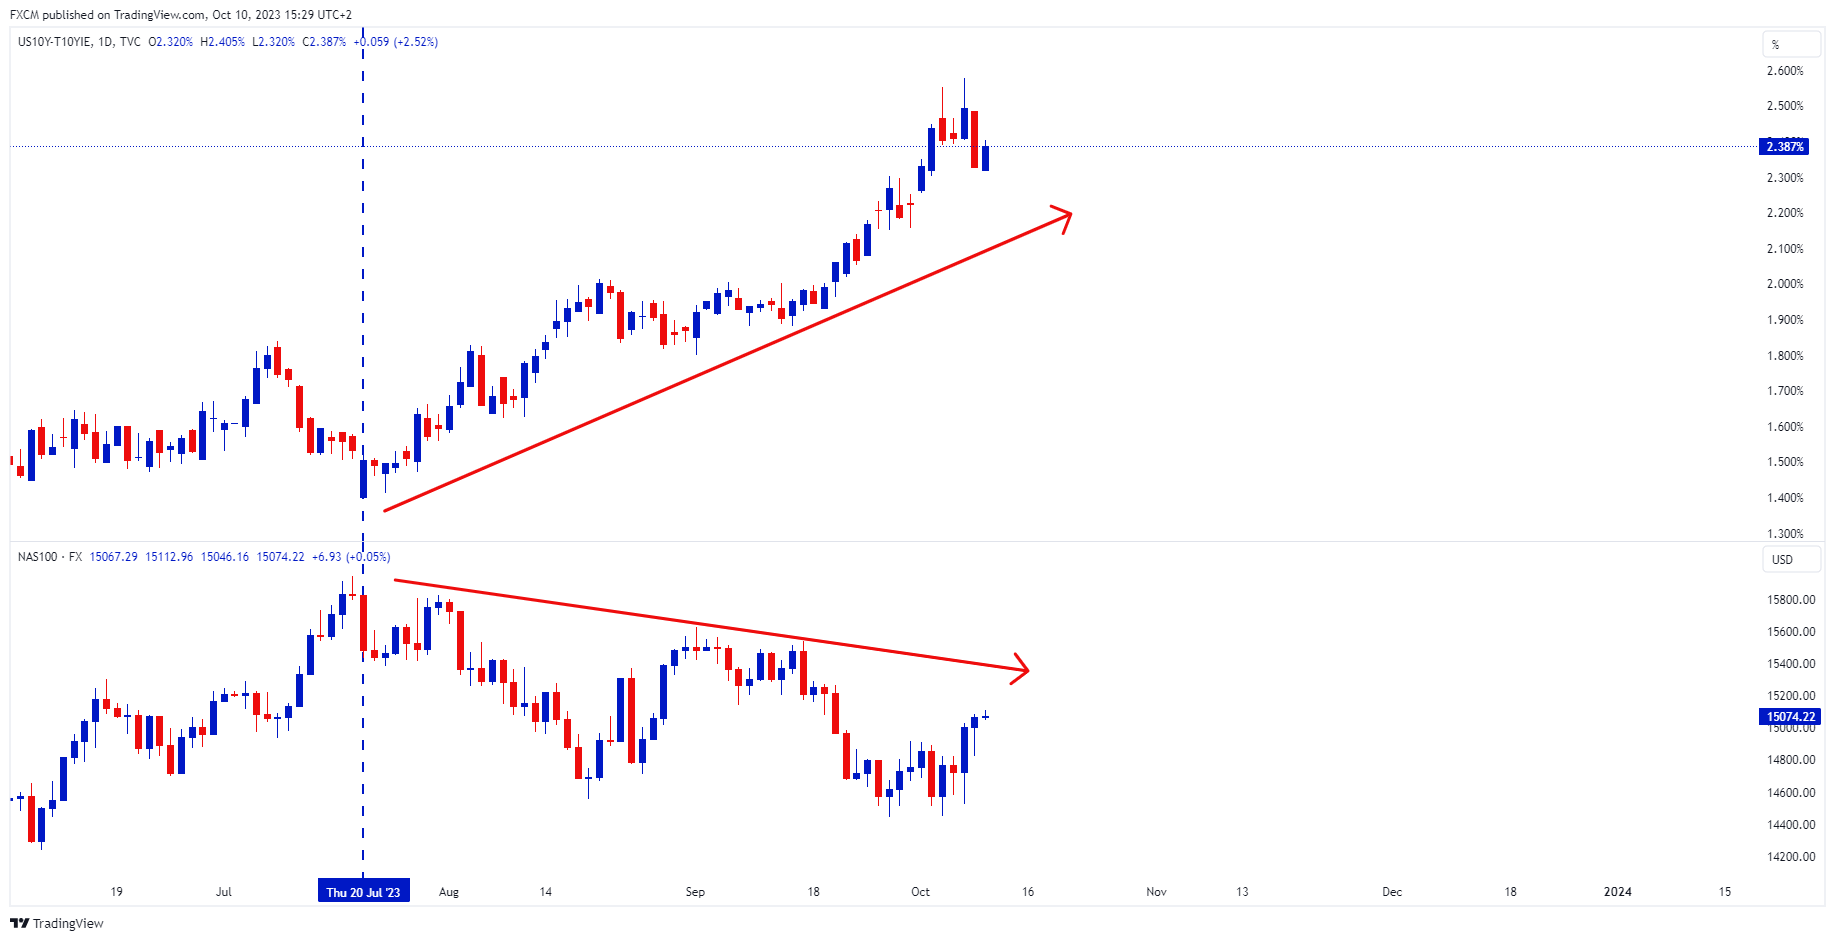
Source: www.tradingview.com
The NAS100 is very sensitive to interest rates. As interest rates increase, it acts as a headwind for the index. This is precisely what has happened since the end of July (blue dashed vertical). As the US 10-year real rate increased (top chart), the NAS100 has been under pressure (bottom chart).
The Real Rate is Overbought
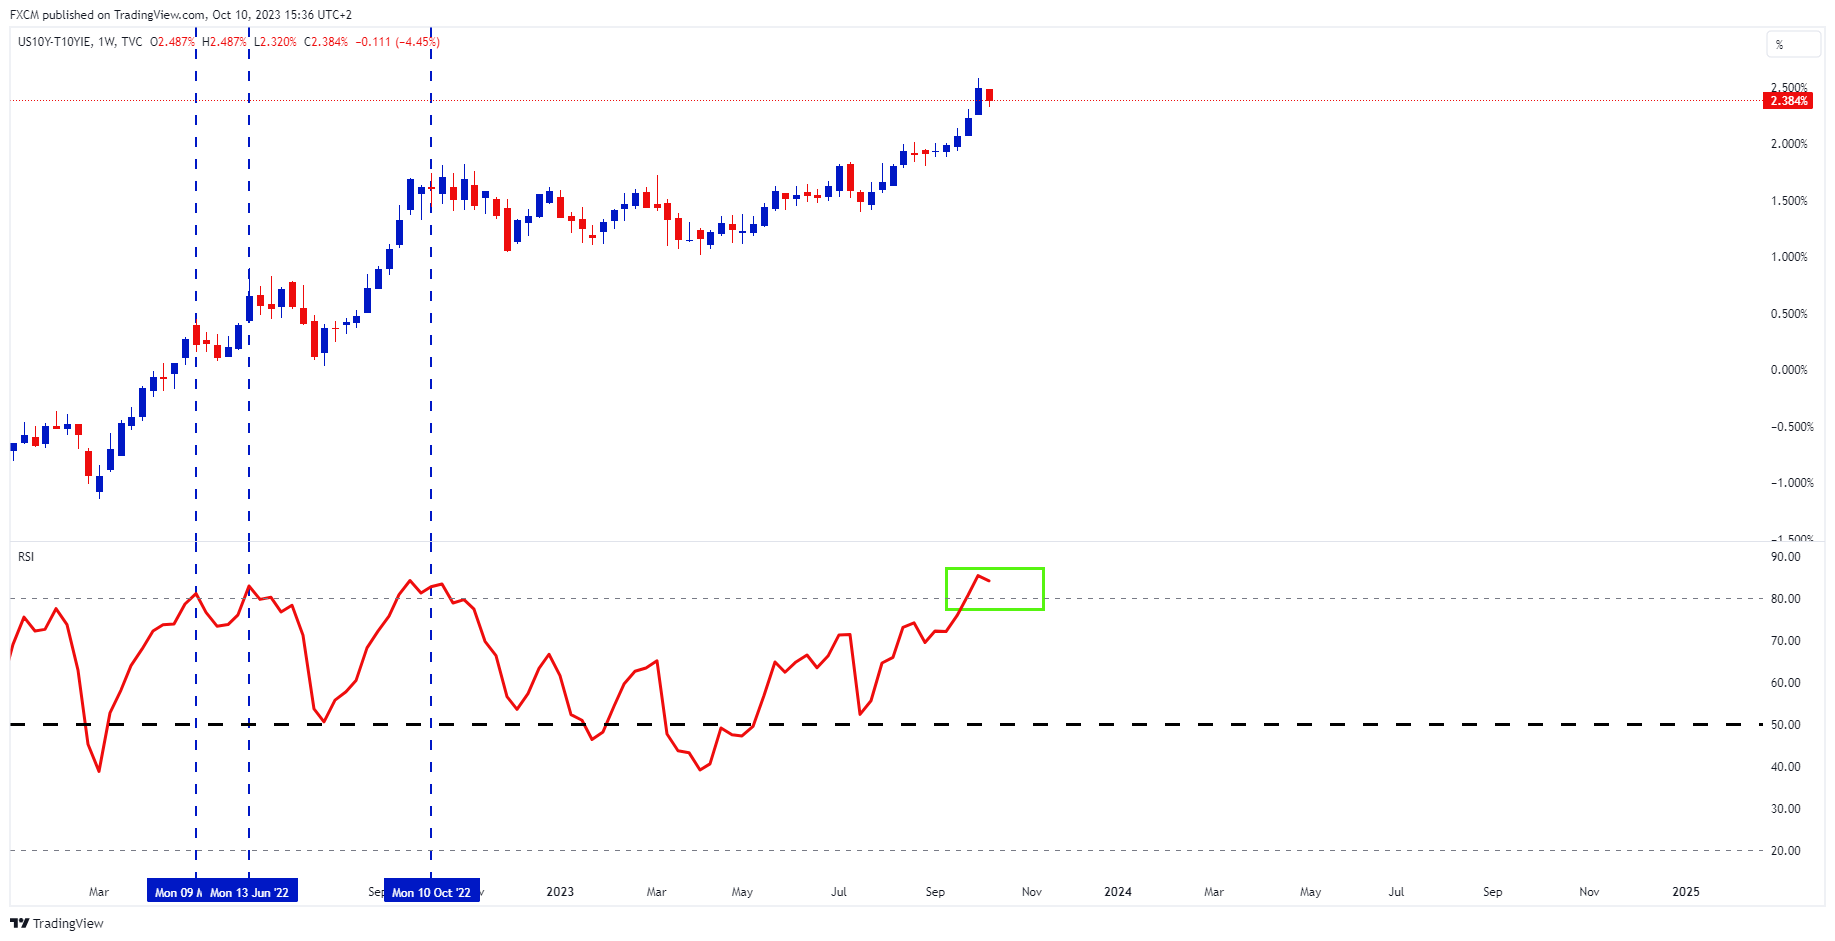
Source: www.tradingview.com
It is interesting to note that the US 10-year real rate is overbought. Its weekly RSI is above 80 (green rectangle), which suggests that the yield has overextended. Generally, when the RSI has been over 80 in the past, the yield does pullback or pause.
Thus, we question how much higher can the yield go? At least in the short-to-medium term. If there is some normalisation here, it is likely to filter through to the NAS100 and push the index higher. I.e., a potential breakout of the NAS100's symmetrical triangle is a possibility.
Higher For Longer
The "higher for longer" narrative has been the key driver of the real rate, mainly due to a tight labour market and a resilient US economy. Yields have pulled back this week and can be traced back to the remarks made by two Federal Reserve officials yesterday. The market is focusing on Lorie Logan's (President of the Dallas Federal Reserve) comments: "Higher term premiums result in higher term interest rates for the same setting of the fed funds rate, all else equal. Thus, if term premiums rise, they could do some of the work of cooling the economy for us, leaving less need for additional monetary policy tightening."
It will be interesting to see if the real rate's RSI uses these words as the catalyst to normalise or if it remains elevated. Either way, we think that the real rates will have an affect on the NAS100's descending triangle.

Russell Shor
Senior Market Specialist
Russell Shor joined FXCM in October 2017 as a Senior Market Specialist. He is a certified FMVA® and has an Honours Degree in Economics from the University of South Africa. Russell is a full member of the Society of Technical Analysts in the United Kingdom. With over 20 years of financial markets experience, his analysis is of a high standard and quality.
Any opinions, news, research, analyses, prices, other information, or links to third-party sites contained on this website are provided on an "as-is" basis, as general market commentary and do not constitute investment advice. The market commentary has not been prepared in accordance with legal requirements designed to promote the independence of investment research, and it is therefore not subject to any prohibition on dealing ahead of dissemination. Although this commentary is not produced by an independent source, FXCM takes all sufficient steps to eliminate or prevent any conflicts of interests arising out of the production and dissemination of this communication. The employees of FXCM commit to acting in the clients' best interests and represent their views without misleading, deceiving, or otherwise impairing the clients' ability to make informed investment decisions. For more information about the FXCM's internal organizational and administrative arrangements for the prevention of conflicts, please refer to the Firms' Managing Conflicts Policy. Please ensure that you read and understand our Full Disclaimer and Liability provision concerning the foregoing Information, which can be accessed here.