Major Cryptos Mostly Upbeat, Bitcoin Tests Key Technical Levels

BTC/USD Analysis
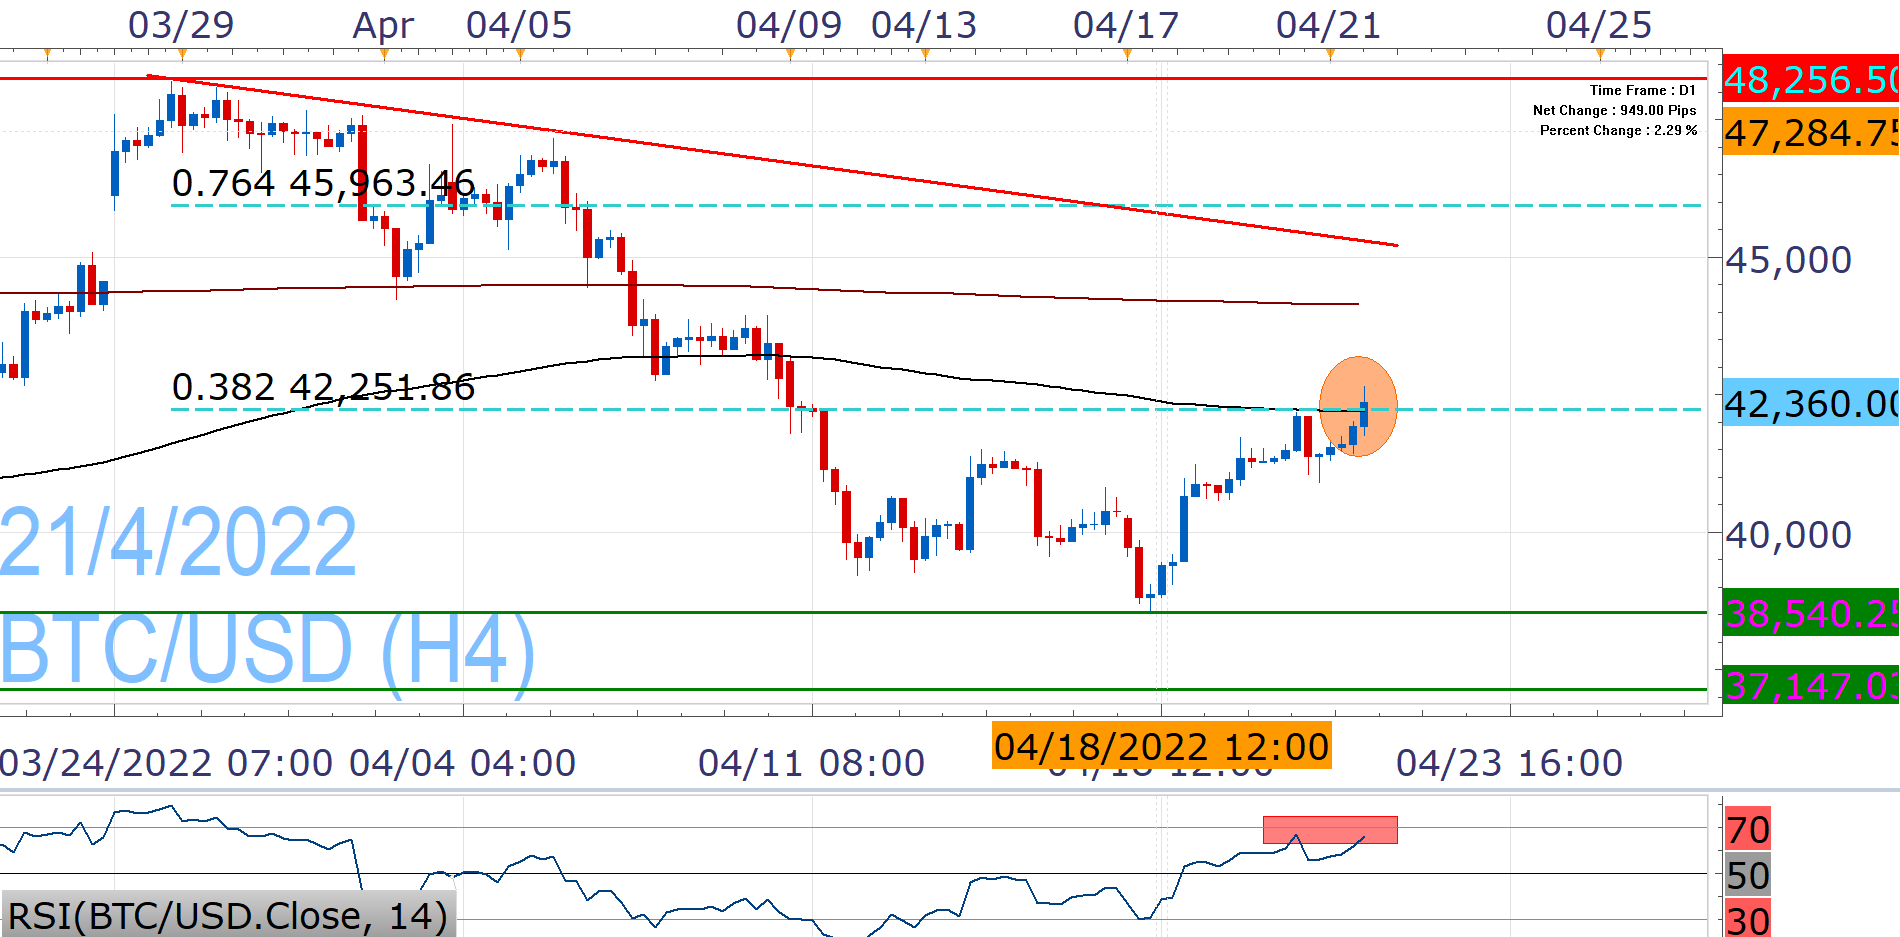
The cryptocurrency comes from two negative weeks and the new one started with fresh April lows, but has since been recovering, entering today the fifth consecutive profitable day. Yesterday it had rejected the EMA200 and the 38.2% Fibonacci of the 2022 High/April Low decline, but today it breaks fresh ground.
This can drive it towards the 200Days EMA (at around 44,200-44,520), but we are cautious at this stage around its ascending prospects, as there are more roadblocks ahead, such as the ascending trendline from this year's highs.
Despite the recent winning streak, BTC/USD runs a losing month, while the RSI points to overbought conditions and as long as it does not clear the EMA200, it is in precarious position. As such, there is risk for a return below 40,888-33, but it may be early for fresh monthly lows (38,540).

Nikos Tzabouras
Senior Financial Editorial Writer
Nikos Tzabouras is a graduate of the Department of International & European Economic Studies at the Athens University of Economics and Business. He has a long time presence at FXCM, as he joined the company in 2011. He has served from multiple positions, but specializes in financial market analysis and commentary.
With his educational background in international relations, he emphasizes not only on Technical Analysis but also in Fundamental Analysis and Geopolitics – which have been having increasing impact on financial markets. He has longtime experience in market analysis and as a host of educational trading courses via online and in-person sessions and conferences.
Any opinions, news, research, analyses, prices, other information, or links to third-party sites contained on this website are provided on an "as-is" basis, as general market commentary and do not constitute investment advice. The market commentary has not been prepared in accordance with legal requirements designed to promote the independence of investment research, and it is therefore not subject to any prohibition on dealing ahead of dissemination. Although this commentary is not produced by an independent source, FXCM takes all sufficient steps to eliminate or prevent any conflicts of interests arising out of the production and dissemination of this communication. The employees of FXCM commit to acting in the clients' best interests and represent their views without misleading, deceiving, or otherwise impairing the clients' ability to make informed investment decisions. For more information about the FXCM's internal organizational and administrative arrangements for the prevention of conflicts, please refer to the Firms' Managing Conflicts Policy. Please ensure that you read and understand our Full Disclaimer and Liability provision concerning the foregoing Information, which can be accessed here.