Large reversal pattern suggests a target over 40% lower than current bitcoin price

Source: www.tradingview.com
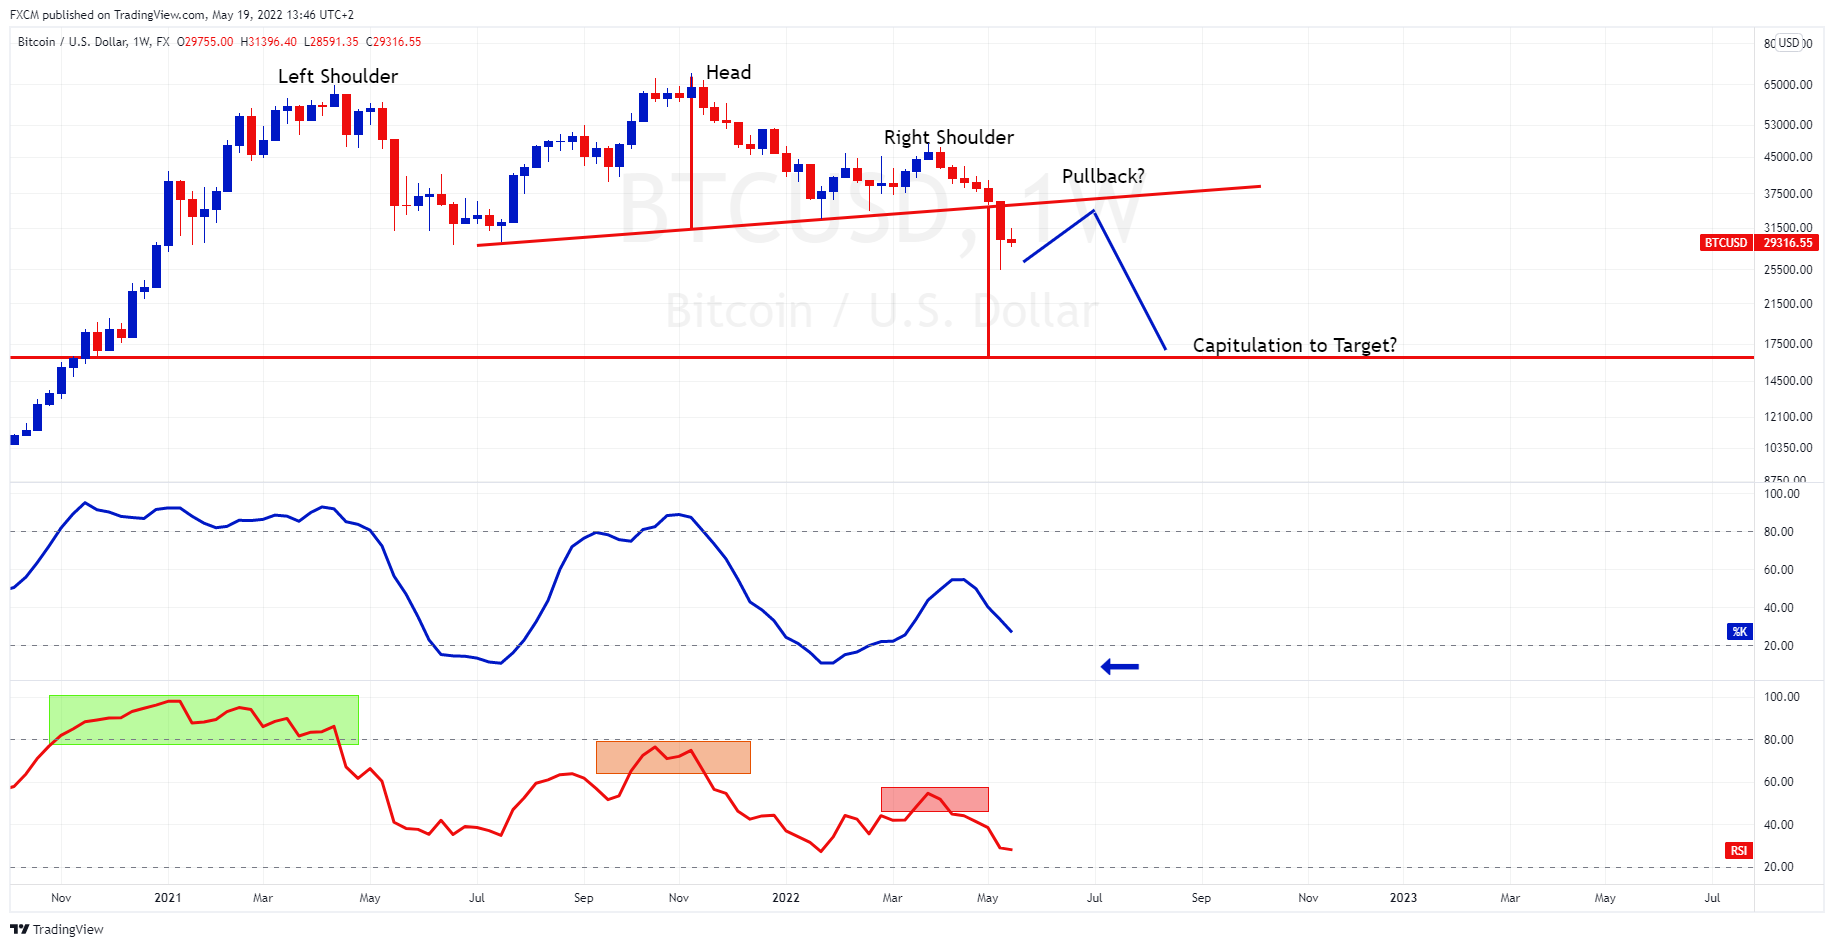
Bitcoin completed its larger reversal pattern last week. It is a "head and shoulders" top, with the left shoulder approximately the same height as the pattern's head. Our reasoning for this is that high emotional buying accompanied the left side of the pattern. This exuberance is evident in the RSI, which stayed overbought for six months (green shaded rectangle).
In juxtaposition, the right shoulder charted at a 30% discount to the bitcoin high of $68,966. Sentiment had dropped off markedly. As the pattern progressed, market momentum deteriorated. The RSI peaks moved from the exuberant green shaded area to the orange shaded area and then the weak red shaded area.
The measured move of the head and shoulders gives a downside target of around $16,500. This measurement suggests a decline of over 40% from current levels. However, price doesn't move in a straight line, and a pullback before capitulation is undoubtedly possible. The key is to recognise the pullback as the next lower peak in the series.
The problem with measured moves is that they tend to be academic. So either price hits the target, or it doesn't. Nevertheless, it suggests continued bearishness.
Another problem with targets is that a time scale should accompany them. In our view, the contractionary monetary policy is weighing heavily on bitcoin. Inflation is still a major bugbear for the Fed, and we cannot discount the likelihood of continued aggressive tightening. This siphoning of liquidity will be a headwind for the cryptocurrency market.
Moreover, crypto markets have lost credibility and trust following the collapse of TerraUSD and Tether's dip from its dollar peg. Importantly, regulators have taken notice.
Thus, we believe the target may be achieved before year-end unless there is a stark change in monetary policy and investor sentiment towards cryptocurrencies.
The key is to keep an eye on the stochastic. Bearish pressure will be intense if it falls below 20 and maintains that position (blue arrow). The longer the stochastic remains in its lower quintile, the more credible the target becomes.

Russell Shor
Senior Market Specialist
Russell Shor joined FXCM in October 2017 as a Senior Market Specialist. He is a certified FMVA® and has an Honours Degree in Economics from the University of South Africa. Russell is a full member of the Society of Technical Analysts in the United Kingdom. With over 20 years of financial markets experience, his analysis is of a high standard and quality.
Any opinions, news, research, analyses, prices, other information, or links to third-party sites contained on this website are provided on an "as-is" basis, as general market commentary and do not constitute investment advice. The market commentary has not been prepared in accordance with legal requirements designed to promote the independence of investment research, and it is therefore not subject to any prohibition on dealing ahead of dissemination. Although this commentary is not produced by an independent source, FXCM takes all sufficient steps to eliminate or prevent any conflicts of interests arising out of the production and dissemination of this communication. The employees of FXCM commit to acting in the clients' best interests and represent their views without misleading, deceiving, or otherwise impairing the clients' ability to make informed investment decisions. For more information about the FXCM's internal organizational and administrative arrangements for the prevention of conflicts, please refer to the Firms' Managing Conflicts Policy. Please ensure that you read and understand our Full Disclaimer and Liability provision concerning the foregoing Information, which can be accessed here.