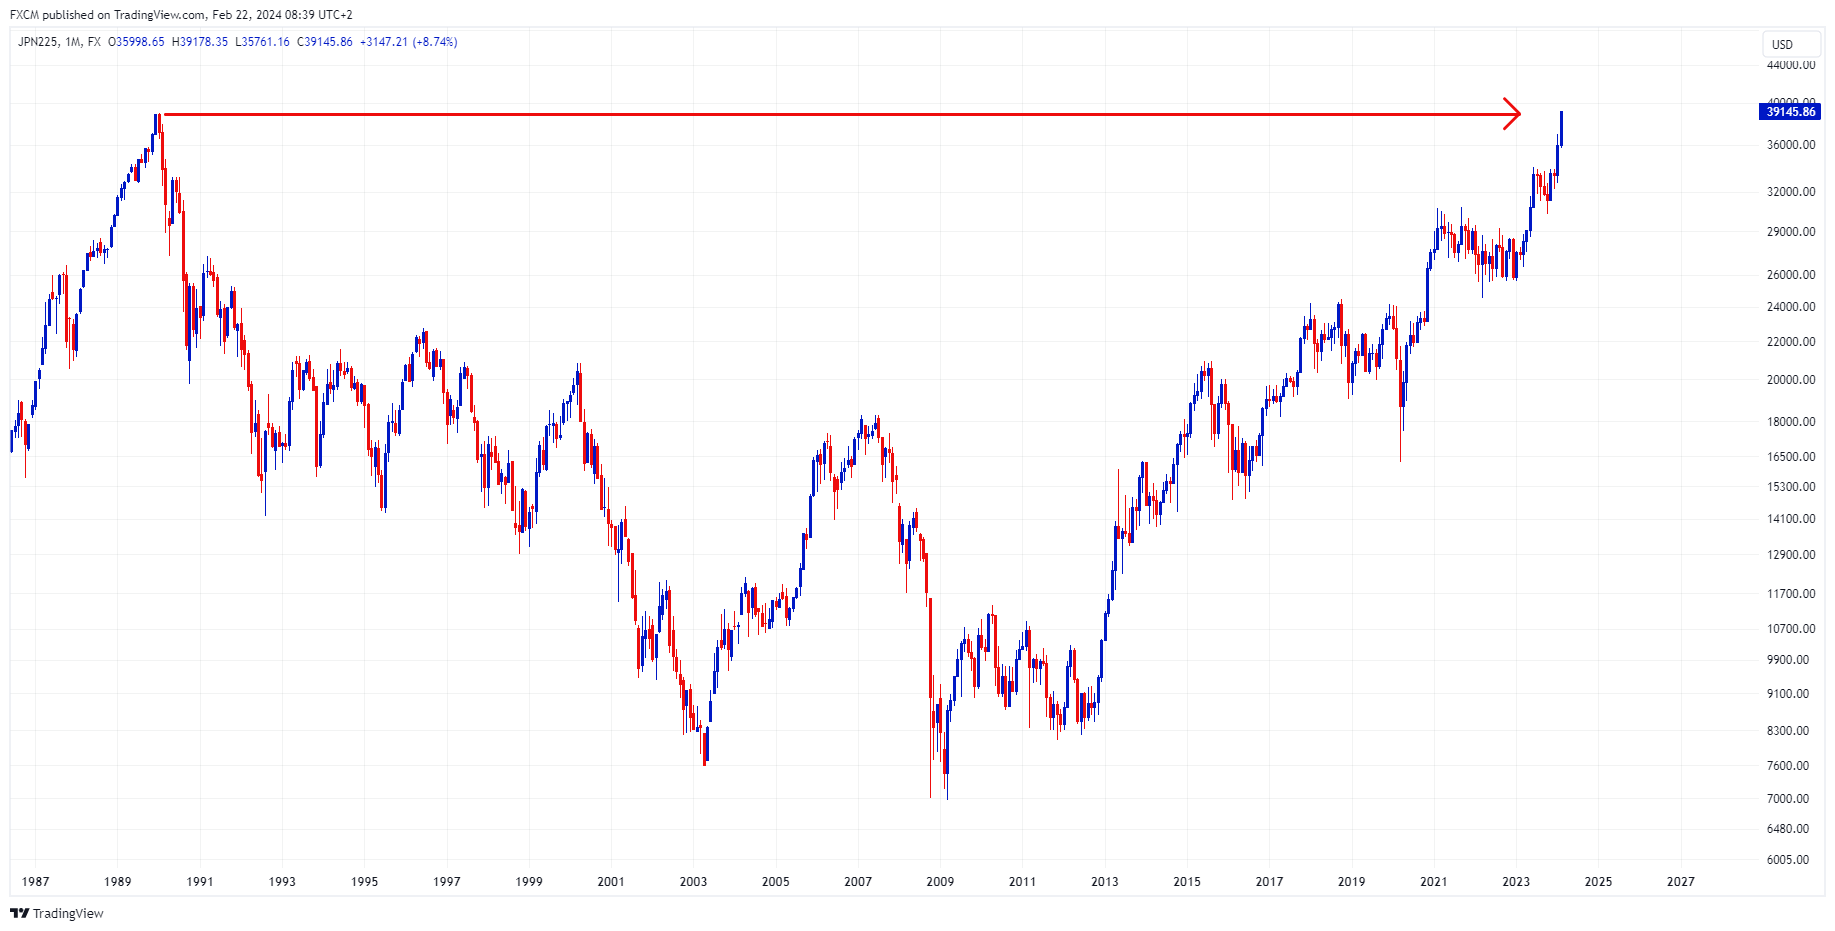
JPN225 reaches new high after almost 35 years

Source: www.tradingview.com
Japan's Nikkei 225 (JPN225) hit a record today, trading at a high of 39,178. This is higher than the previous high of 38,915 reached in 1989. The Japanese index has been powered by a weaker yen, strong earnings, and investor-friendly measures.
Capital has rotated into Japanese equities as the Japanese government pursued corporate governance reforms, and the possibility that net profits for the fiscal year ending March 2024 may hit record highs for the third consecutive year. Quarterly earnings ending December have generally risen by 45% from the same period a year earlier and are 14% higher than consensus according to Goldman Sachs.
Tsutomu Yamada, a senior market analyst at au Kabucom Securities said, "for us traders, this marks the arrival of a new era. It feels like the stock market is telling us that we've finally escaped from deflation and a new world has opened up."
The weak yen has helped Japanese exporters but, at the same time, has hurt domestic consumers. Despite core inflation surpassing the 2% target for over a year, the Bank of Japan still maintains negative interest rates. There's anticipation of a shift in April if spring wage negotiations show substantial increases.
Image by Samuele Schirò from Pixabay

Russell Shor
Senior Market Specialist
Russell Shor joined FXCM in October 2017 as a Senior Market Specialist. He is a certified FMVA® and has an Honours Degree in Economics from the University of South Africa. Russell is a full member of the Society of Technical Analysts in the United Kingdom. With over 20 years of financial markets experience, his analysis is of a high standard and quality.
Any opinions, news, research, analyses, prices, other information, or links to third-party sites contained on this website are provided on an "as-is" basis, as general market commentary and do not constitute investment advice. The market commentary has not been prepared in accordance with legal requirements designed to promote the independence of investment research, and it is therefore not subject to any prohibition on dealing ahead of dissemination. Although this commentary is not produced by an independent source, FXCM takes all sufficient steps to eliminate or prevent any conflicts of interests arising out of the production and dissemination of this communication. The employees of FXCM commit to acting in the clients' best interests and represent their views without misleading, deceiving, or otherwise impairing the clients' ability to make informed investment decisions. For more information about the FXCM's internal organizational and administrative arrangements for the prevention of conflicts, please refer to the Firms' Managing Conflicts Policy. Please ensure that you read and understand our Full Disclaimer and Liability provision concerning the foregoing Information, which can be accessed here.