Intel CEO buys into dip

Intel Stock gapped down on 26 January following the chip makers outlook for Q1 2024, which lagged analysts' forecasts. However, it is notable that the company's stock price nearly doubled in 2023, surging by 91%.
Interestingly, Intel's CEO, Pat Gelsinger, took the opportunity to buy into the dip, buying Intel stock on the open market. Gelsinger bought 3,000 shares on 29 January for $130,100, at an average price of $43.36. He bought the shares through a family trust that now owns 28,485 shares. The CEO also personally owns 62,023 Intel shares and another 457,000 through other trusts.
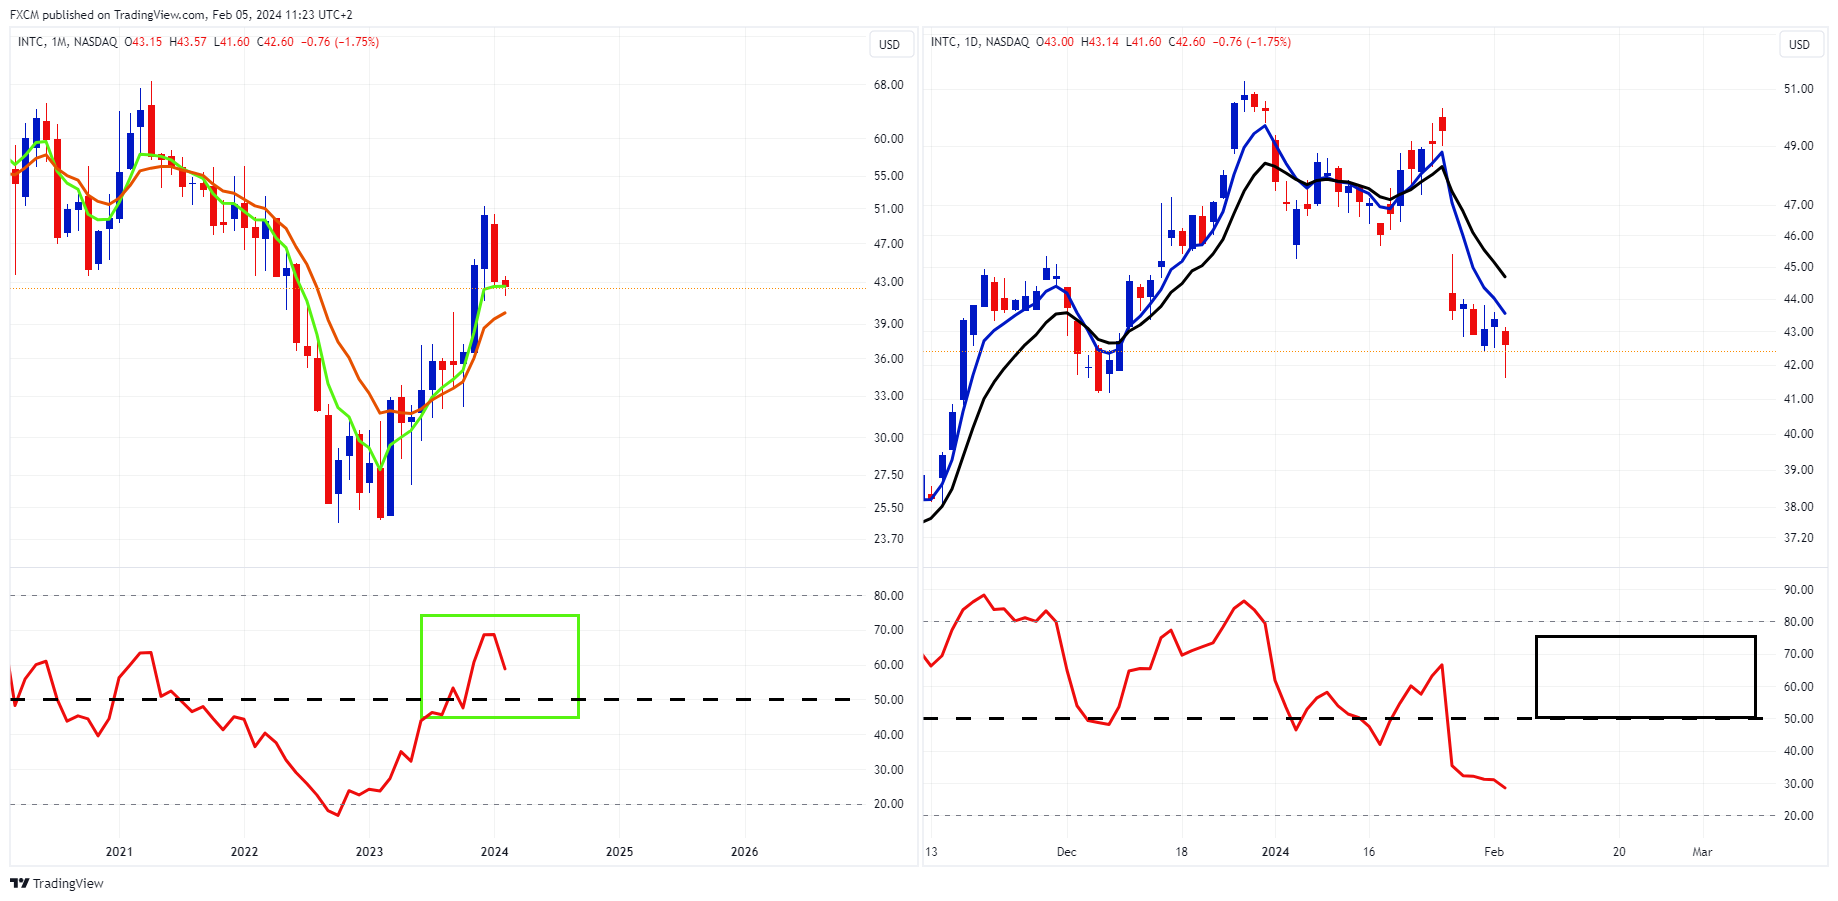
Source: www.tradingview.com
Technically speaking, Intel remains in a long-term uptrend with its green 5-month EMA above its orange 10-month EMA, and the monthly RSI above 50 (green rectangle). Moreover, if the blue 5-day EMA crosses above the black 10-day EMA, and the RSI pops above 50 (black rectangle), the "dip in the uptrend" scenario will potentially be playing out.

Russell Shor
Senior Market Specialist
Russell Shor joined FXCM in October 2017 as a Senior Market Specialist. He is a certified FMVA® and has an Honours Degree in Economics from the University of South Africa. Russell is a full member of the Society of Technical Analysts in the United Kingdom. With over 20 years of financial markets experience, his analysis is of a high standard and quality.
Any opinions, news, research, analyses, prices, other information, or links to third-party sites contained on this website are provided on an "as-is" basis, as general market commentary and do not constitute investment advice. The market commentary has not been prepared in accordance with legal requirements designed to promote the independence of investment research, and it is therefore not subject to any prohibition on dealing ahead of dissemination. Although this commentary is not produced by an independent source, FXCM takes all sufficient steps to eliminate or prevent any conflicts of interests arising out of the production and dissemination of this communication. The employees of FXCM commit to acting in the clients' best interests and represent their views without misleading, deceiving, or otherwise impairing the clients' ability to make informed investment decisions. For more information about the FXCM's internal organizational and administrative arrangements for the prevention of conflicts, please refer to the Firms' Managing Conflicts Policy. Please ensure that you read and understand our Full Disclaimer and Liability provision concerning the foregoing Information, which can be accessed here.