Higher Real Yields Impacting on SPX500

Real Yields
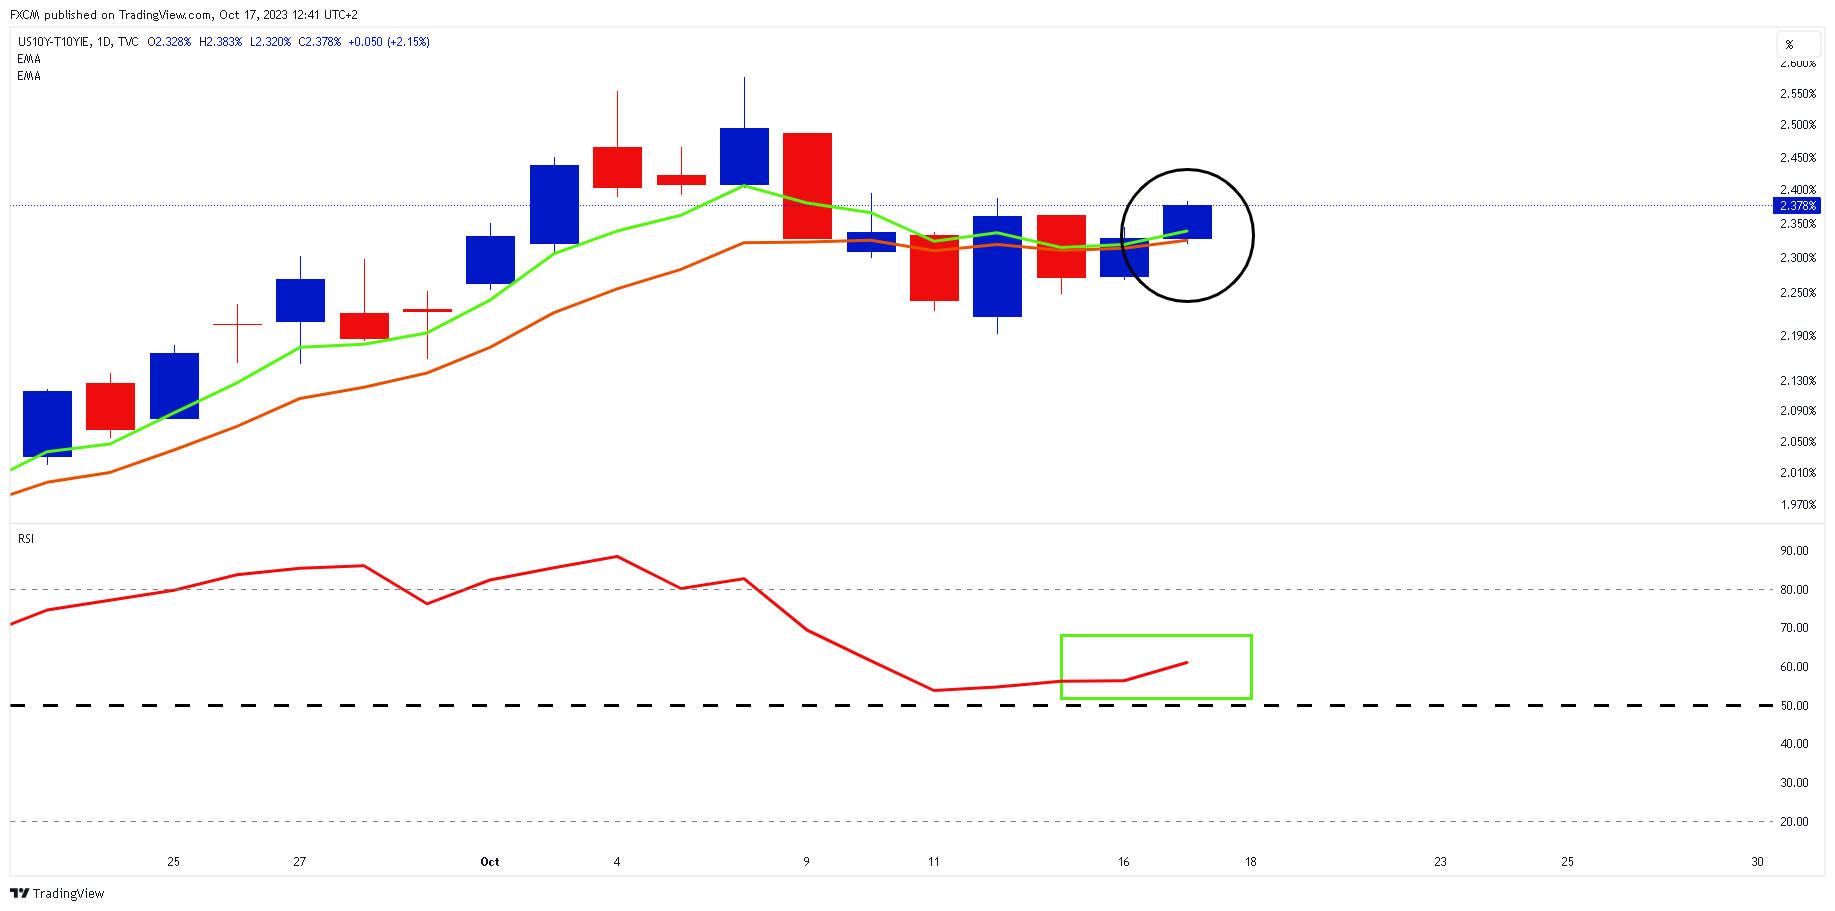
Source: www.tradingview.com
The US 10-year real yield is moving higher. Its green 5-day EMA is pulling away from its orange 10-day EMA (black circle) and the RSI is moving higher and away from 50 (green rectangle). As yields appreciate, they tend to act as a headwind to the risk side of the market.
SPX500 Hourly Analysis
.png)
1. As the daily real yield pushes higher the SPX500 is under pressure on its hourly timeframe.
2. Its green 5-hour EMA is below its orange 10-hour EMA (top black ellipse), putting the EMAs into a bearish formation.
3. The stochastic has crossed down (bottom black ellipse) and is heading towards 20 and below (blue arrow).
4. If the EMAs develop angle and separation to the downside and the stochastic drops below 20 and holds (blue arrow), and underlying bearish momentum will be driving the SPX500.
5. This will keep the index under pressure.

Russell Shor
Senior Market Specialist
Russell Shor joined FXCM in October 2017 as a Senior Market Specialist. He is a certified FMVA® and has an Honours Degree in Economics from the University of South Africa. Russell is a full member of the Society of Technical Analysts in the United Kingdom. With over 20 years of financial markets experience, his analysis is of a high standard and quality.
Any opinions, news, research, analyses, prices, other information, or links to third-party sites contained on this website are provided on an "as-is" basis, as general market commentary and do not constitute investment advice. The market commentary has not been prepared in accordance with legal requirements designed to promote the independence of investment research, and it is therefore not subject to any prohibition on dealing ahead of dissemination. Although this commentary is not produced by an independent source, FXCM takes all sufficient steps to eliminate or prevent any conflicts of interests arising out of the production and dissemination of this communication. The employees of FXCM commit to acting in the clients' best interests and represent their views without misleading, deceiving, or otherwise impairing the clients' ability to make informed investment decisions. For more information about the FXCM's internal organizational and administrative arrangements for the prevention of conflicts, please refer to the Firms' Managing Conflicts Policy. Please ensure that you read and understand our Full Disclaimer and Liability provision concerning the foregoing Information, which can be accessed here.