Higher Real Yields Continue to Pressure Gold

Real Yield and Gold
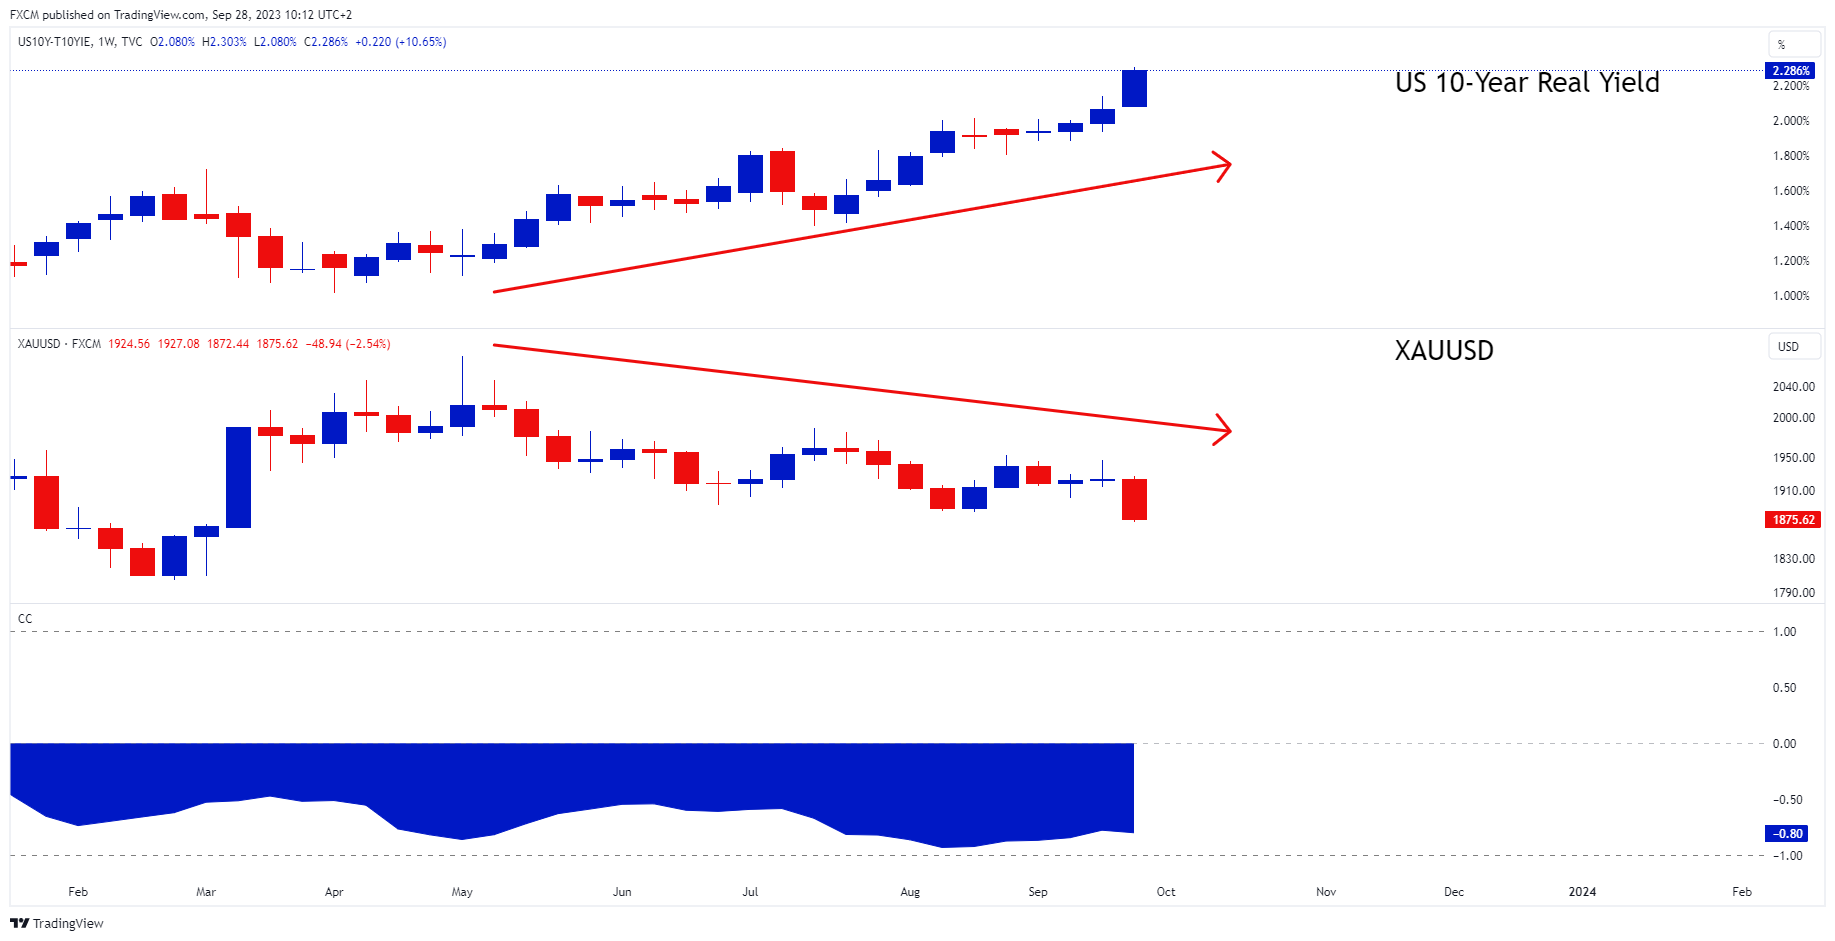
Source: www.tradingview.com
The US 10-year real yield continues to climb higher and is currently at 2.286%, largely due to the Federal Reserve's narrative of "higher for longer." This is adding headwinds to the risk market and driving money towards the safety of the dollar. This, in turn, is impacting on gold. The precious metal is moving inversely to the real yield. To this end, the correlation coefficient (bottom indicator) between gold and the real yield is -80%. This is a strong and negative relationship. I.e., As the real yield continues to push higher, it is impacting negatively on the yellow metal.
Weekly Chart Analysis
.png)
There are several technical signals which are worrying with regards to gold:
- XAUUSD's candlesticks have dropped below its black 30-week EMA and the EMA has turned down.
- Gold has charted a series of lower peaks followed by lower troughs. This puts XAUUSD into a defined downtrend.
- The weekly RSI is below 50 (green rectangle). This is the bearish side of the indicator. The longer the RSI maintains on this side, the more pressure the gold price will be under.
Currently, the key driver for gold is the higher real yields. However, we have noted in a previous article that the real yield is overbought. If this corrects, gold may find support. However, this is still to happen.

Russell Shor
Senior Market Specialist
Russell Shor joined FXCM in October 2017 as a Senior Market Specialist. He is a certified FMVA® and has an Honours Degree in Economics from the University of South Africa. Russell is a full member of the Society of Technical Analysts in the United Kingdom. With over 20 years of financial markets experience, his analysis is of a high standard and quality.
Any opinions, news, research, analyses, prices, other information, or links to third-party sites contained on this website are provided on an "as-is" basis, as general market commentary and do not constitute investment advice. The market commentary has not been prepared in accordance with legal requirements designed to promote the independence of investment research, and it is therefore not subject to any prohibition on dealing ahead of dissemination. Although this commentary is not produced by an independent source, FXCM takes all sufficient steps to eliminate or prevent any conflicts of interests arising out of the production and dissemination of this communication. The employees of FXCM commit to acting in the clients' best interests and represent their views without misleading, deceiving, or otherwise impairing the clients' ability to make informed investment decisions. For more information about the FXCM's internal organizational and administrative arrangements for the prevention of conflicts, please refer to the Firms' Managing Conflicts Policy. Please ensure that you read and understand our Full Disclaimer and Liability provision concerning the foregoing Information, which can be accessed here.