Gold’s uptrend has ended, but downtrend is yet to be confirmed

Gold Weekly Chart Analysis
.png)
XAUUSD charted a series of higher troughs followed by higher peaks from the end of October last year to the end of April this year. This put gold into a defined uptrend. However, from May, this pattern started to show cracks, and eventually a lower trough (LT) was charted. This, in effect, ended the pattern of higher troughs followed by higher peaks, and as such ended the precious metal's uptrend.
Whilst peak and trough analysis does not denote a downtrend at this stage, we do note that the weekly RSI has fallen below 50 (green rectangle). This is the bearish side of the oscillator and the longer it maintains on this side of 50, the more downwards pressure will be applied to the gold price.
Yield and Gold
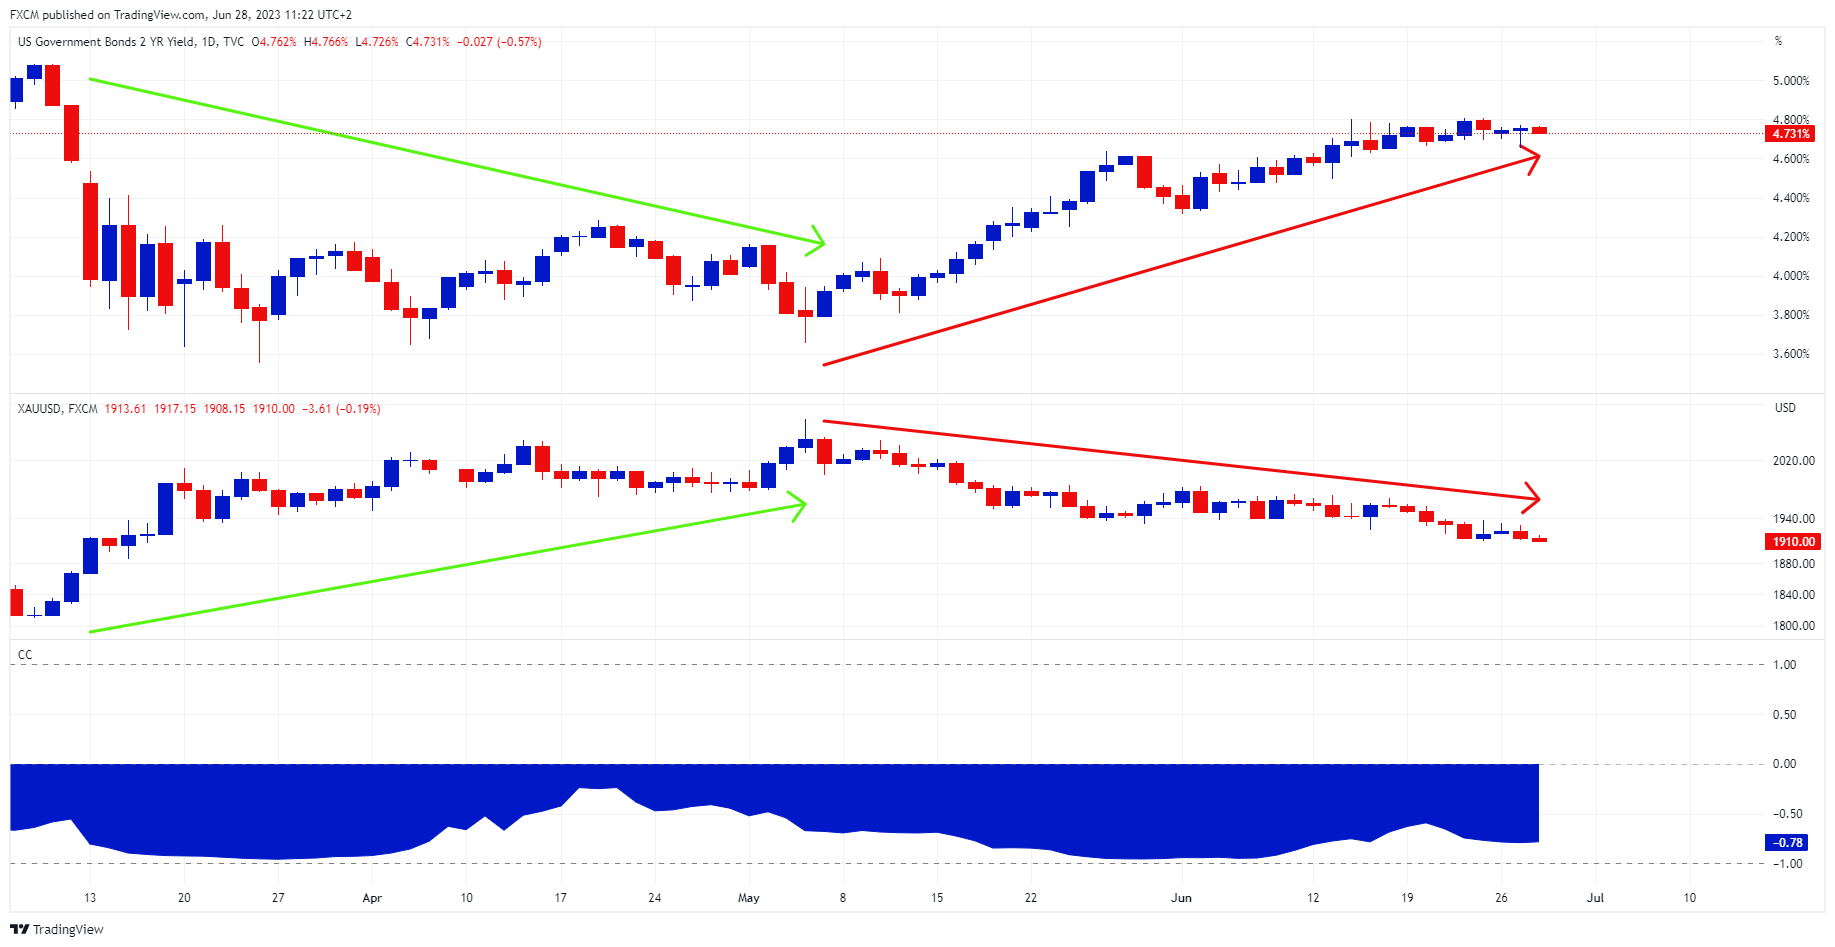
Source: www.tradingview.com
Gold (middle chart) picked up in March as the banking confidence crisis unfolded in the US. Over five days in March, Silvergate Bank, Signature Bank and Silicon Valley Bank failed. This prompted a swift response by regulators to prevent any contagion, which included the Bank Term Funding Program. As a result, the US 2-year yield (top chart) dropped markedly, and the precious metal appreciated.
Gold continued to benefit from the lower yields, as the opportunity cost of holding gold dropped, and as a haven until the 2-year yield bottomed out in May (green arrows). With the crisis averted, yields began to appreciate given the Federal Reserve's general hawkish monetary bias to control inflation, and the precious metal, becoming more expensive to hold, started its decline. This phase is denoted by the red arrows.
The bottom indicator is the correlation coefficient between the US 2-year yield and XAUUSD. It is a robust -78%. I.e., there is a strong but inverse relationship between the two.
Summary
- Gold's uptrend has ended.
- However, a downtrend is yet to confirm.
- The precious metal responded positively to declining yields.
- However, yields bottomed in May, making gold more expensive to hold.
- Since then, XAUUSD has pulled back, charting a lower trough (but not a lower peak).

Russell Shor
Senior Market Specialist
Russell Shor joined FXCM in October 2017 as a Senior Market Specialist. He is a certified FMVA® and has an Honours Degree in Economics from the University of South Africa. Russell is a full member of the Society of Technical Analysts in the United Kingdom. With over 20 years of financial markets experience, his analysis is of a high standard and quality.
Any opinions, news, research, analyses, prices, other information, or links to third-party sites contained on this website are provided on an "as-is" basis, as general market commentary and do not constitute investment advice. The market commentary has not been prepared in accordance with legal requirements designed to promote the independence of investment research, and it is therefore not subject to any prohibition on dealing ahead of dissemination. Although this commentary is not produced by an independent source, FXCM takes all sufficient steps to eliminate or prevent any conflicts of interests arising out of the production and dissemination of this communication. The employees of FXCM commit to acting in the clients' best interests and represent their views without misleading, deceiving, or otherwise impairing the clients' ability to make informed investment decisions. For more information about the FXCM's internal organizational and administrative arrangements for the prevention of conflicts, please refer to the Firms' Managing Conflicts Policy. Please ensure that you read and understand our Full Disclaimer and Liability provision concerning the foregoing Information, which can be accessed here.