Gold shows strength ahead of Jackson Hole Symposium

Real Yield & Gold
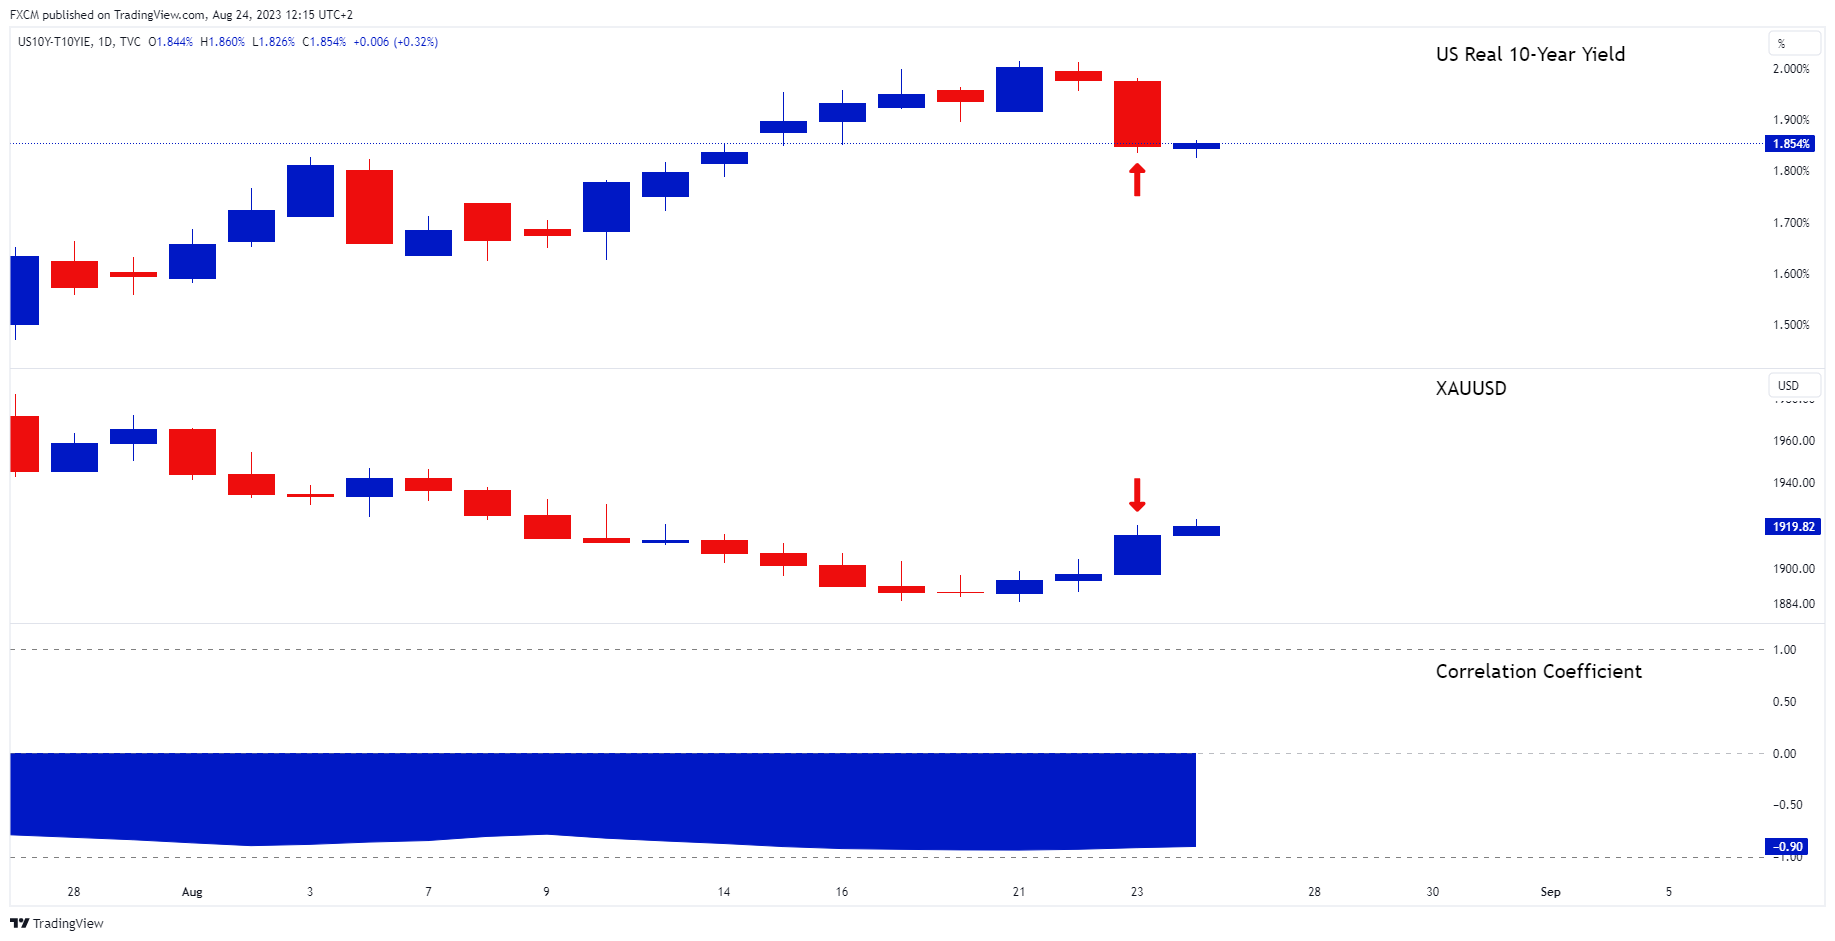
Source: www.tradingview.com
Gold has a robust inverse relationship to the 10-year real yield. The current correlation coefficient on the daily timeframe is -90%. Yesterday, the real yield declined by 6.57% (red arrow), which saw the yellow metal respond and appreciate on the day.
Gold Technical Analysis
.png)
Yesterday's appreciation, saw XAUUSD move from its weak channel between the lower blue and red bands, to its neutral channel between the blue bands. This is a show of strength. The precious metal's daily RSI has popped above 50 (blue rectangle). This is the bullish side of the indicator. If it can maintain on this side, an underlying bullish momentum will be developing, likely to support the gold price.
Jackson Hole Symposium
The Jackson Hole symposium starts today and tomorrow will see the highly anticipated keynote by Fed Chair Powell at 2:05pm GMT. Market participants will be looking for clues regarding interest rates, which may influence the real yield and, as such, the gold price.
Any comments regarding the duration of higher interest rates, or the current neutral rate have the potential to be market moving.

Russell Shor
Senior Market Specialist
Russell Shor joined FXCM in October 2017 as a Senior Market Specialist. He is a certified FMVA® and has an Honours Degree in Economics from the University of South Africa. Russell is a full member of the Society of Technical Analysts in the United Kingdom. With over 20 years of financial markets experience, his analysis is of a high standard and quality.
Any opinions, news, research, analyses, prices, other information, or links to third-party sites contained on this website are provided on an "as-is" basis, as general market commentary and do not constitute investment advice. The market commentary has not been prepared in accordance with legal requirements designed to promote the independence of investment research, and it is therefore not subject to any prohibition on dealing ahead of dissemination. Although this commentary is not produced by an independent source, FXCM takes all sufficient steps to eliminate or prevent any conflicts of interests arising out of the production and dissemination of this communication. The employees of FXCM commit to acting in the clients' best interests and represent their views without misleading, deceiving, or otherwise impairing the clients' ability to make informed investment decisions. For more information about the FXCM's internal organizational and administrative arrangements for the prevention of conflicts, please refer to the Firms' Managing Conflicts Policy. Please ensure that you read and understand our Full Disclaimer and Liability provision concerning the foregoing Information, which can be accessed here.