Gold Likely To Face Pressure If Yields Rise

The charts below show an interesting relationship between gold and bonds. The top chart is XAUUSD, the middle chart is IEF - iShares 7-10yr Bond ETF, and the bottom chart is the US 10 Yr. Treasury yield. The red trendline shows the period between the third quarter of 2018 to the middle of 2020. During this period, gold and bond prices both appreciated, whilst yields declined. The orange trendline represents the period from the second half of 2020 to the first quarter of 2021. This period is characterised by falling gold and bond prices, and higher yields. The green trendline defines the period from the beginning of the second quarter of 2021 until the present. Here, gold and bonds show a slight appreciation and yields a slight depreciation. These three time periods define a positive relationship between gold and bond prices and an inverse relationship between the precious metal and bond yields. Given the hawkish tone of the Fed's minutes for December, the odds favour a rise in yields. This being the case, and given the identified relationships, XAUUSD very well come under pressure.
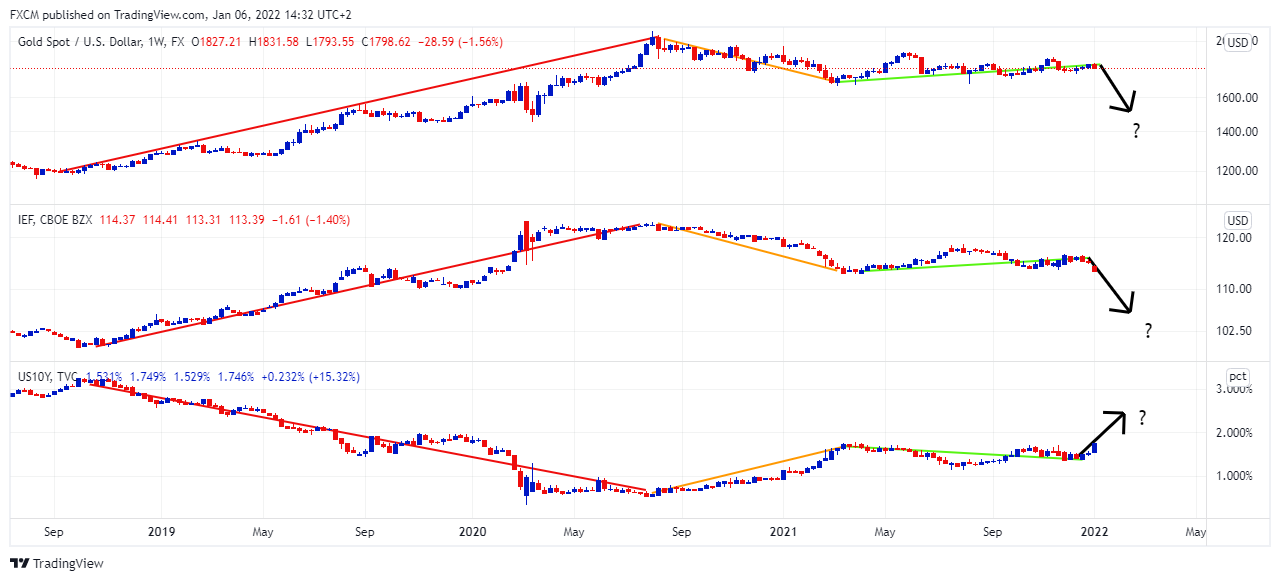
Source: www.tradingview.com
Past Performance: Past Performance is not an indicator of future results.
Featured Image by Linda Hamilton from Pixabay

Russell Shor
Senior Market Specialist
Russell Shor joined FXCM in October 2017 as a Senior Market Specialist. He is a certified FMVA® and has an Honours Degree in Economics from the University of South Africa. Russell is a full member of the Society of Technical Analysts in the United Kingdom. With over 20 years of financial markets experience, his analysis is of a high standard and quality.
Any opinions, news, research, analyses, prices, other information, or links to third-party sites contained on this website are provided on an "as-is" basis, as general market commentary and do not constitute investment advice. The market commentary has not been prepared in accordance with legal requirements designed to promote the independence of investment research, and it is therefore not subject to any prohibition on dealing ahead of dissemination. Although this commentary is not produced by an independent source, FXCM takes all sufficient steps to eliminate or prevent any conflicts of interests arising out of the production and dissemination of this communication. The employees of FXCM commit to acting in the clients' best interests and represent their views without misleading, deceiving, or otherwise impairing the clients' ability to make informed investment decisions. For more information about the FXCM's internal organizational and administrative arrangements for the prevention of conflicts, please refer to the Firms' Managing Conflicts Policy. Please ensure that you read and understand our Full Disclaimer and Liability provision concerning the foregoing Information, which can be accessed here.