Gold is Under Pressure but is Oversold in the Short-Term

Monthly Chart Analsysis
.png)
1. The gold monthly chart is looking fragile.
2. The precious metal's green 5-month EMA is attempting to cross below its orange 10-month EMA (black ellipse), which would be a bearish development.
3. The monthly close will clarify whether the EMAs have definitively crossed to the downside.
4. Moreover, the monthly RSI has dipped below 50 (green rectangle).
5. This is the bearish side of the indicator and the longer the RSI stays below 50, the greater the likelihood of a lower gold price ahead.
Weekly Chart Analysis
.png)
1. The weekly chart shows that XAUUSD has charted a series of lower peaks followed by lower troughs.
2. This puts the weekly chart into a defined downtrend.
3. This is emphasised by the weekly candlesticks trading below the black 30-week EMA and the EMA pointing down.
4. The RSI is on the bearish side of of 50 (green rectangle), which denotes that momentum is currently to the downside.
The Key Driver
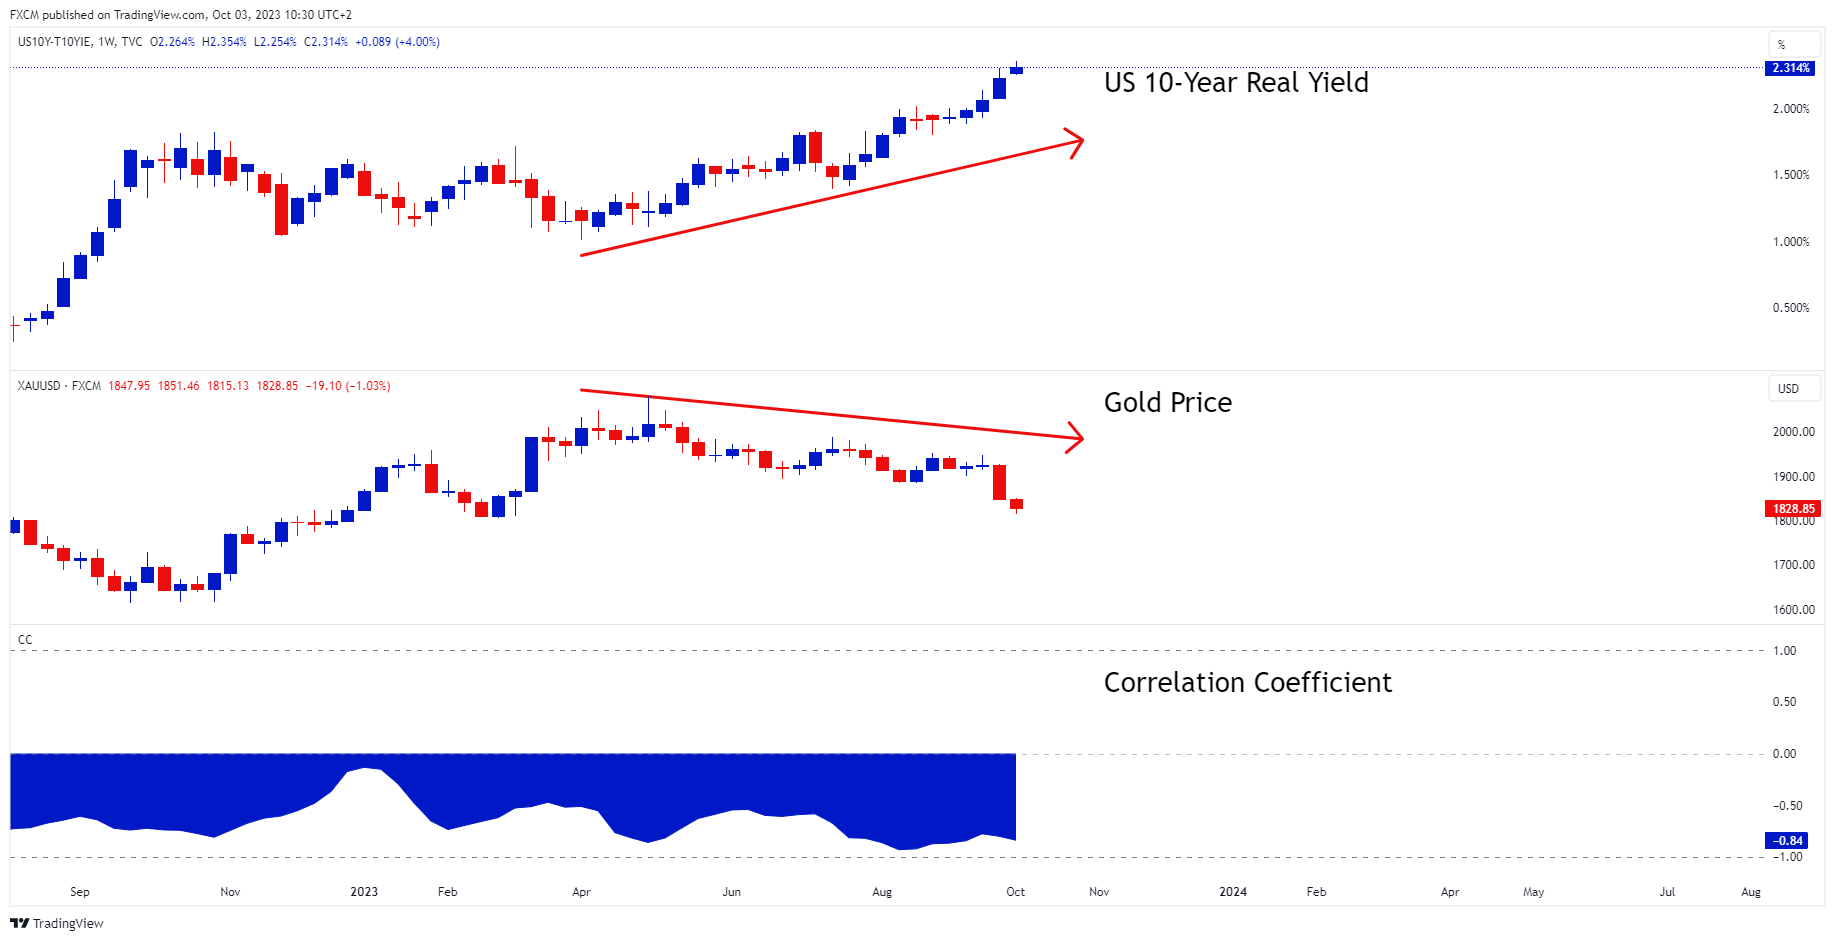
Source: www.tradingview.com
- The key driver of the gold price is the higher real yield.
- As the US 10-year real yield has moved higher the gold price has moved lower.
- Currently, the correlation coefficient between the two is an exceptionally strong -84%.
- This suggests a strong negative relationship between the real yield and gold.
- As yield goes higher, the opportunity cost of holding gold increases.
- As a result, the precious metal has declined.
Gold is Oversold on The Daily Chart
.png)
1. The gold price has dropped markedly since 20 September.
2. The fast pace of decline has pushed the daily gold chart into oversold territory.
3. This is evident because the RSI has dropped below the 20 level (green rectangle).
4. It is not surprising given that the daily real yield is currently at an overbought reading.
5. Gold's RSI is unlikely to stay oversold for a lengthy period.
6. Therefore, a bounce or rally in the gold price will not be surprising, given that the RSI is expected to normalise in the near term.
7. However, the precious metal has a lot of work to do on the monthly and weekly charts for its trend to turn more positive.

Russell Shor
Senior Market Specialist
Russell Shor joined FXCM in October 2017 as a Senior Market Specialist. He is a certified FMVA® and has an Honours Degree in Economics from the University of South Africa. Russell is a full member of the Society of Technical Analysts in the United Kingdom. With over 20 years of financial markets experience, his analysis is of a high standard and quality.
Any opinions, news, research, analyses, prices, other information, or links to third-party sites contained on this website are provided on an "as-is" basis, as general market commentary and do not constitute investment advice. The market commentary has not been prepared in accordance with legal requirements designed to promote the independence of investment research, and it is therefore not subject to any prohibition on dealing ahead of dissemination. Although this commentary is not produced by an independent source, FXCM takes all sufficient steps to eliminate or prevent any conflicts of interests arising out of the production and dissemination of this communication. The employees of FXCM commit to acting in the clients' best interests and represent their views without misleading, deceiving, or otherwise impairing the clients' ability to make informed investment decisions. For more information about the FXCM's internal organizational and administrative arrangements for the prevention of conflicts, please refer to the Firms' Managing Conflicts Policy. Please ensure that you read and understand our Full Disclaimer and Liability provision concerning the foregoing Information, which can be accessed here.