Gold Attracts Safe-Heaven Flows as Middle East Violence Flares Up

XAU/USD Analysis
Palestinian group Hamas launched a surprise and deadly attack on Israel, which retaliated with operation Swords of Iron. The flare up in the Middle East conflict boosts oil prices and sends gold higher as well, as the latter attracts risk-off flows.
XAU/USD managed to avoid fresh 2023 lows the risk aversion may give it the change to reclaim the EMA200 (at round 1,891). Daily closes above would pause the downside bias, but we are cautious around its ascending prospects and the upside looks unhospitable, with multiple roadblocks.
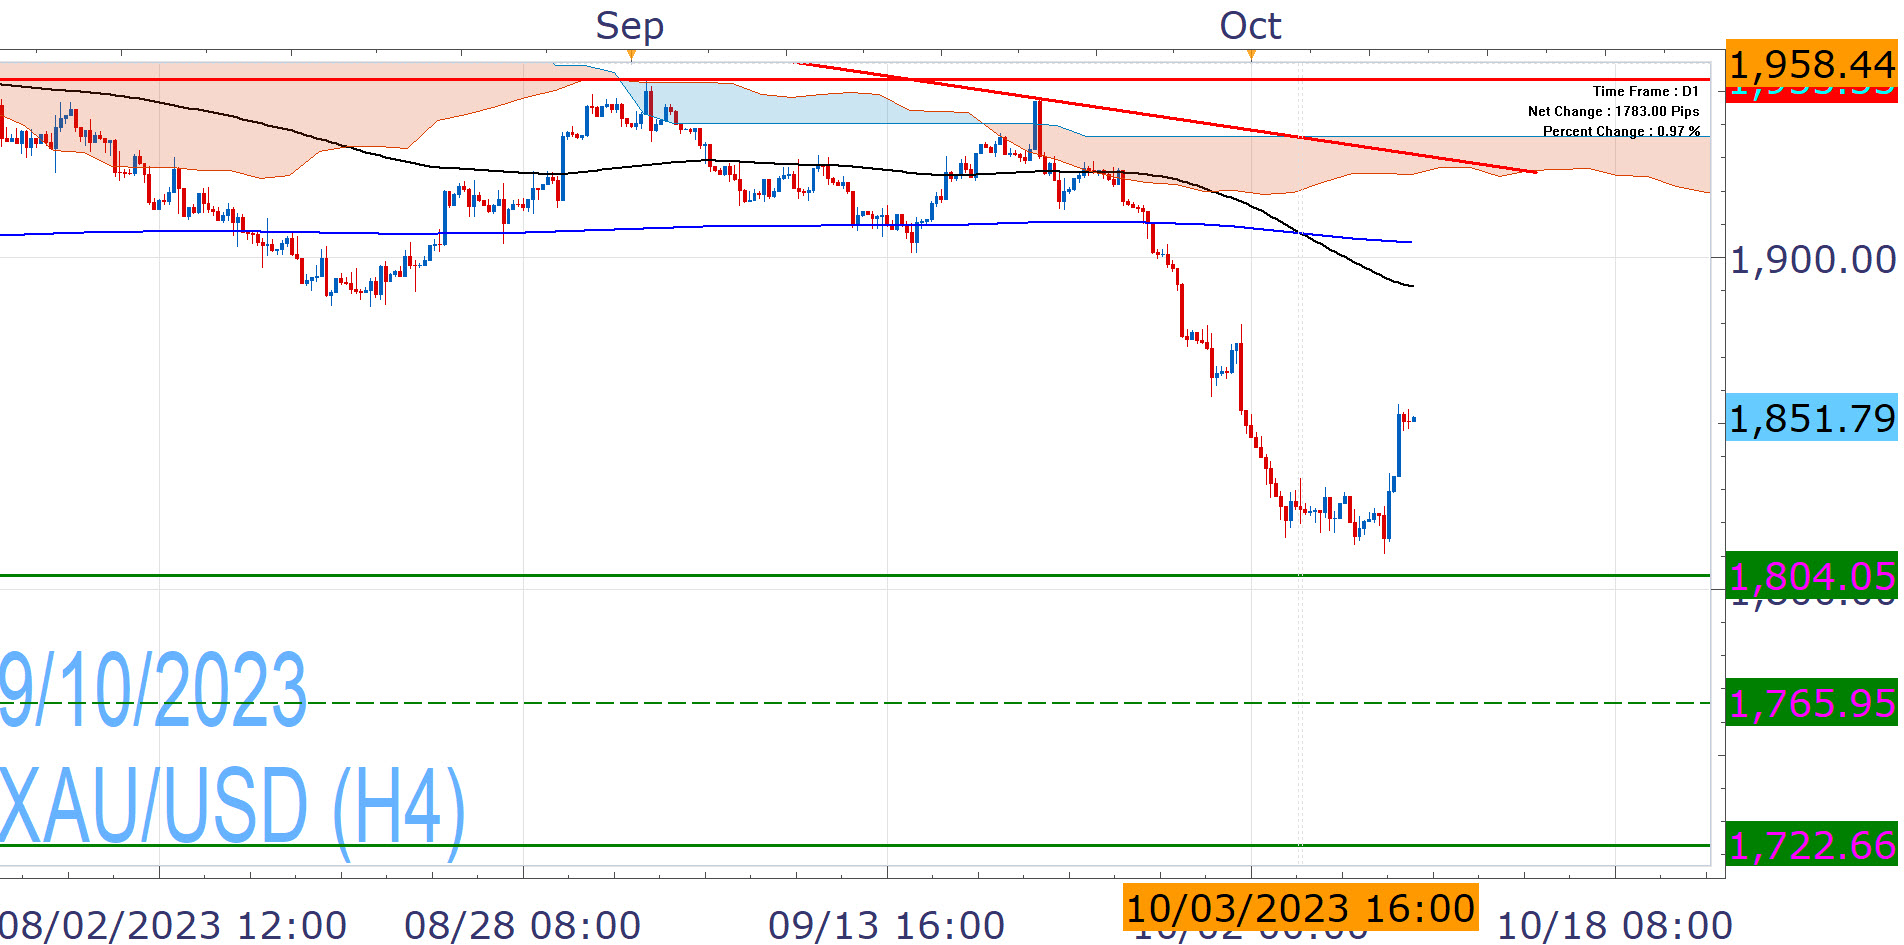
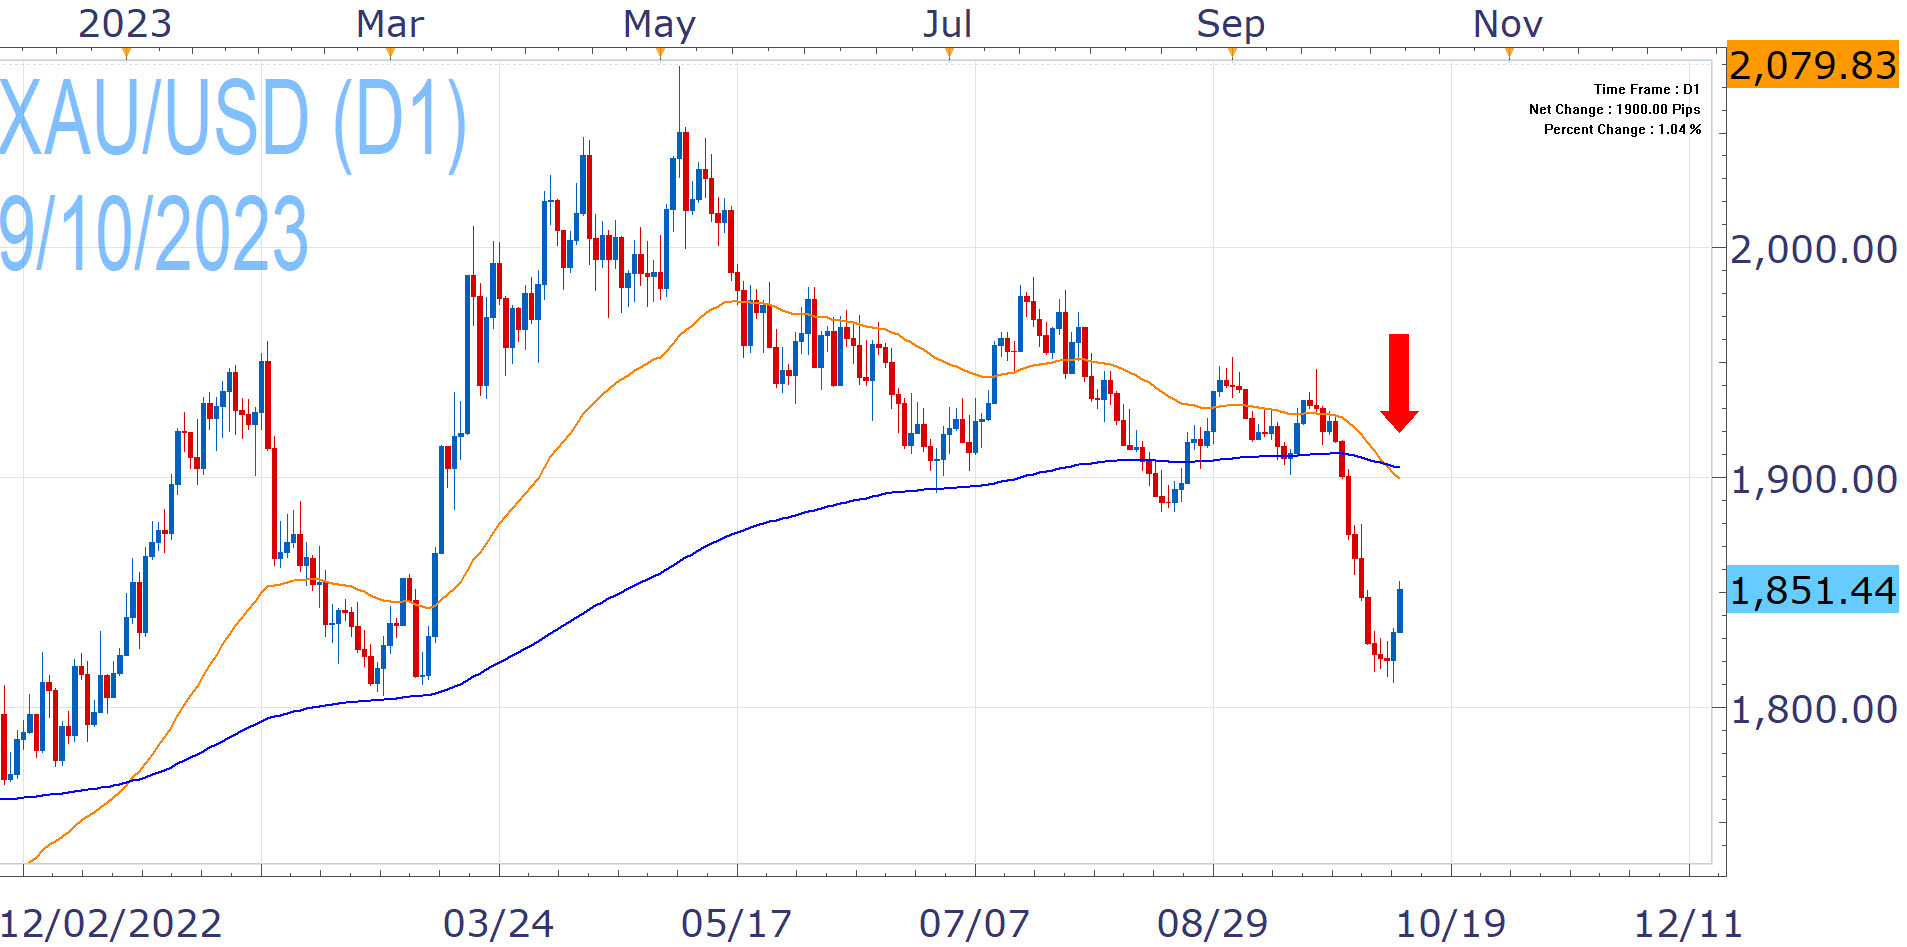
Despite today's surge, XAU/USD comes from a losing month die to the Fed's hawkish bias which benefits the greenback and Friday's strong NFPs support the higher-for-longer narrative. The commodity is in risk of new 2023 lows (1,804), although further losses towards and beyond 1,765 may prove elusive in the near term. The daily chart is also unfavorable since a Death Cross has formed (EMA50 < EMA200), which is often a precursor of sustained weakness.

Nikos Tzabouras
Senior Financial Editorial Writer
Nikos Tzabouras is a graduate of the Department of International & European Economic Studies at the Athens University of Economics and Business. He has a long time presence at FXCM, as he joined the company in 2011. He has served from multiple positions, but specializes in financial market analysis and commentary.
With his educational background in international relations, he emphasizes not only on Technical Analysis but also in Fundamental Analysis and Geopolitics – which have been having increasing impact on financial markets. He has longtime experience in market analysis and as a host of educational trading courses via online and in-person sessions and conferences.
Any opinions, news, research, analyses, prices, other information, or links to third-party sites contained on this website are provided on an "as-is" basis, as general market commentary and do not constitute investment advice. The market commentary has not been prepared in accordance with legal requirements designed to promote the independence of investment research, and it is therefore not subject to any prohibition on dealing ahead of dissemination. Although this commentary is not produced by an independent source, FXCM takes all sufficient steps to eliminate or prevent any conflicts of interests arising out of the production and dissemination of this communication. The employees of FXCM commit to acting in the clients' best interests and represent their views without misleading, deceiving, or otherwise impairing the clients' ability to make informed investment decisions. For more information about the FXCM's internal organizational and administrative arrangements for the prevention of conflicts, please refer to the Firms' Managing Conflicts Policy. Please ensure that you read and understand our Full Disclaimer and Liability provision concerning the foregoing Information, which can be accessed here.