Gig-Economy: Uber vs Lyft Earnings
GIG ECONOMY
The two US based companies compete in the ride-sharing arena, operating in what has come to be known as the gig-economy – a sector that has seen a massive expansion in the last few years, thanks to them and other ride-hailing/delivery platforms.
This expansion however, has been accompanied by issues and legal battles around driver's rights, with such firms generally preferring to classify workers as self-employed and not employees.
Q3 EARNINGS
Lyft announced its Q3 financial results on Tuesday November 4 after US market close, with its co-founder and CEO commenting that "driver supply materially improved in Q3, up nearly 45% versus last year". [1]
Revenues rose to $864 million, whereas Net Loss narrowed to $71.539 million, from $251.9 million in the previous quarter and $459.5 million a year ago.
Uber followed on Thursday November 4 after markets closed, announcing Revenue increase to $4.845 billion, with its Delivery business being the largest contributor and also having the largest percentage rise (y/y).
The company however, reported a Net Loss of $2.424 billion largely due to the revaluation of its investment on Didi. [2]
STOCK MOVEMENT
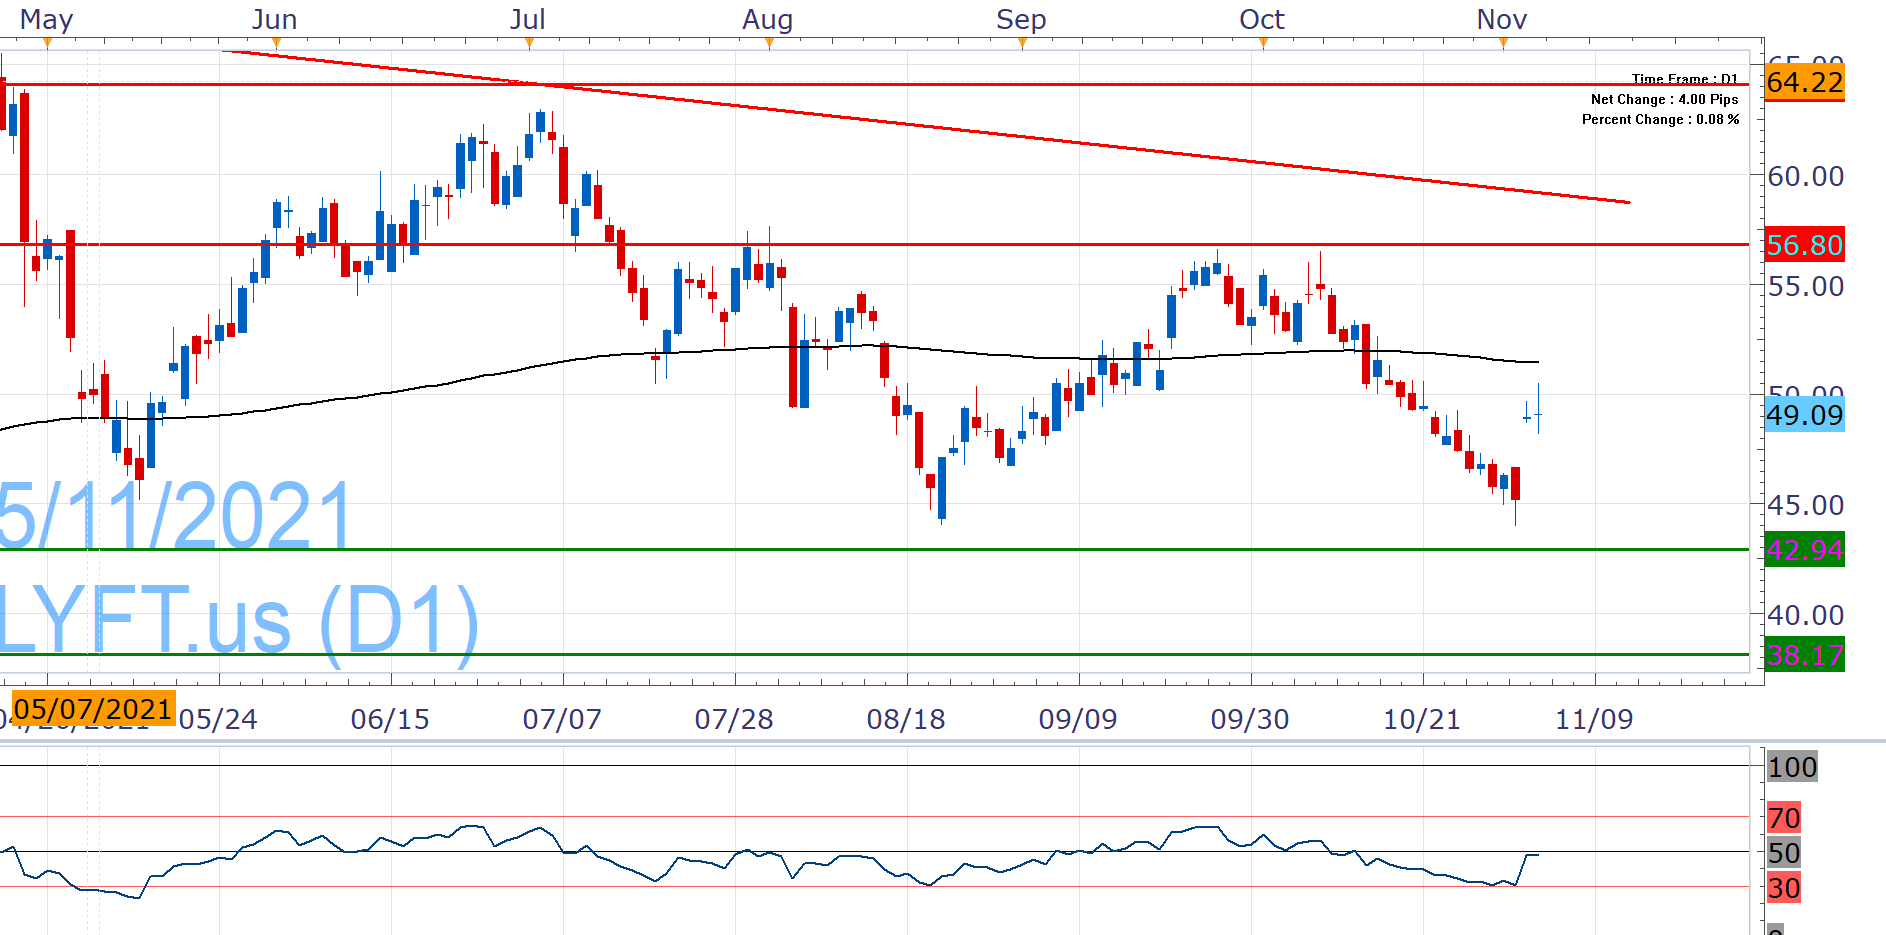
LYFT.us jumped on Wednesday after the solid financial results and has turned positive on the month, following October's retreat. The stock has the ability to push through its EMA200 (at around 55150) and daily closes above that level would allow it to look towards the September-October highs (56.71-80).
Despite this week's gains, as long as it trades below the EMA200 and RSI does not break above 50, LYFT.us remains vulnerable to the downside. It could breach 47.00, which would bring its 2021 lows (42.94) into play.
Past Performance: Past Performance is not an indicator of future results.
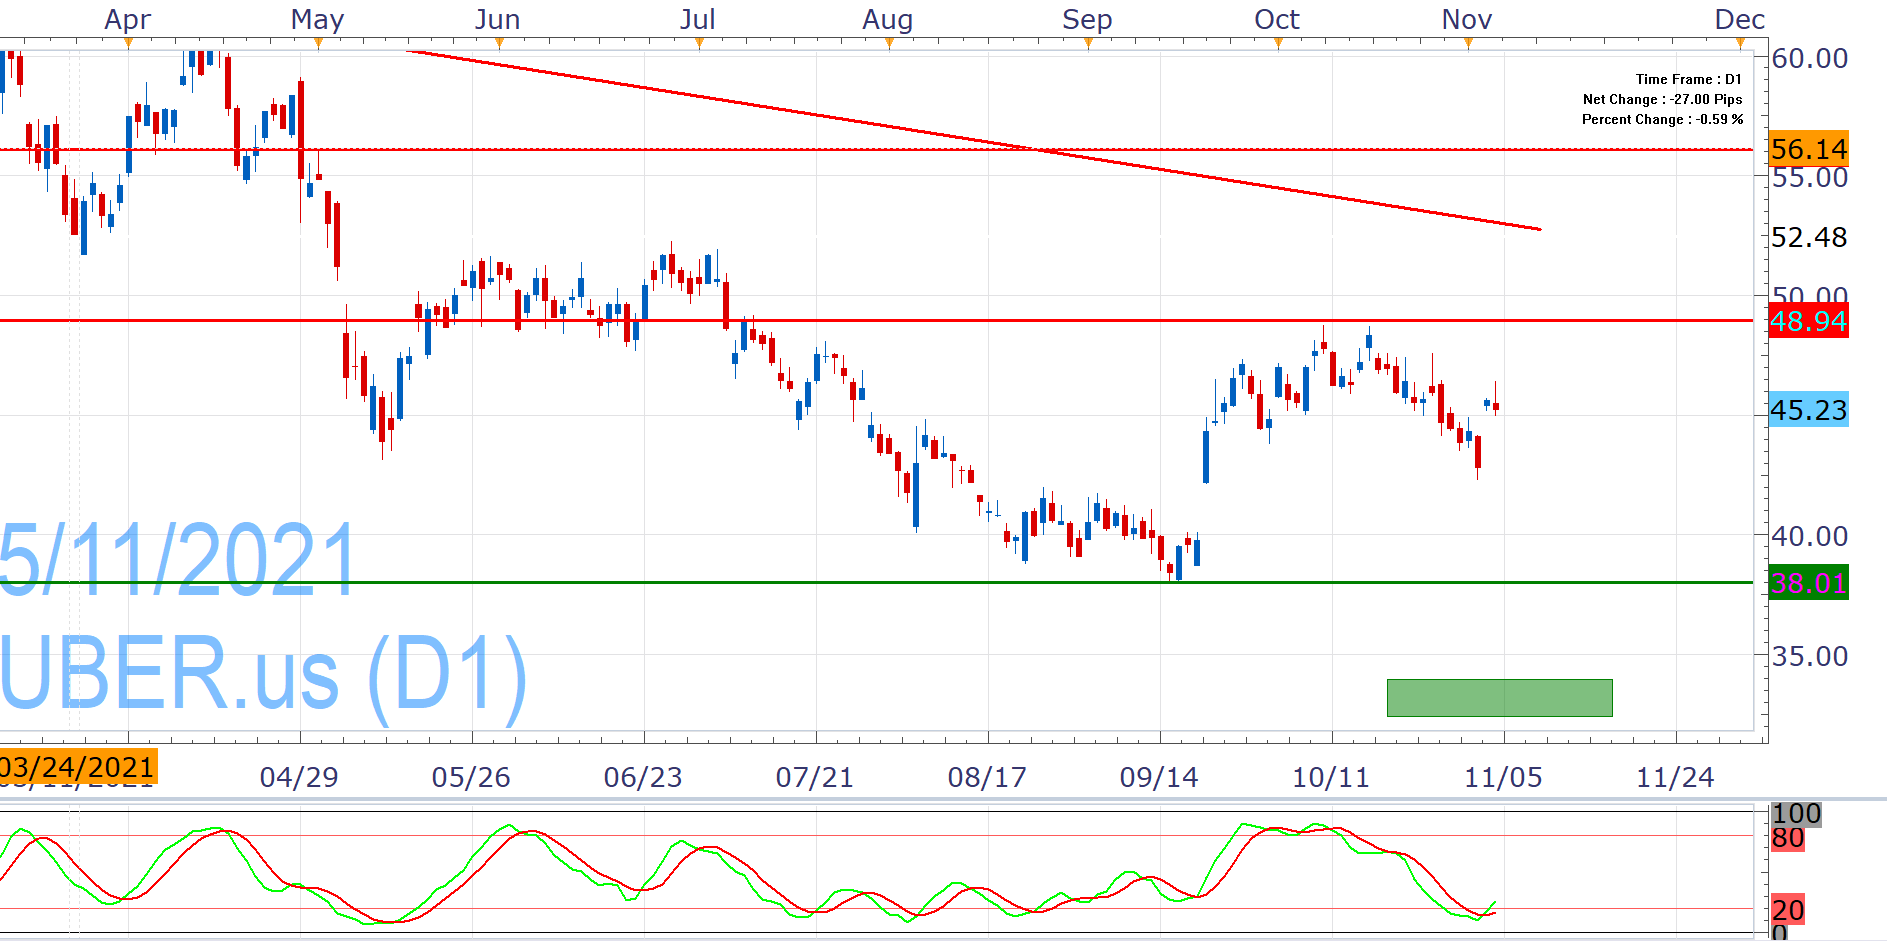
UBER.us also has positive month so far, but yesterday's Net Loss is likely to push it lower at the beginning of today's trading. Such a scenario would create risk for fresh November lows (42.27) which will bring its 2021 lows in the spotlight (38.01).
On the other hand, the Stochastic indicates that UBER.us can push higher and claim the 48.94-50.00 area, but does not yet inspire confidence for tackling the descending trend line form its record high (above 52.00).
Past Performance: Past Performance is not an indicator of future results.

Nikos Tzabouras
Senior Financial Editorial Writer
Nikos Tzabouras is a graduate of the Department of International & European Economic Studies at the Athens University of Economics and Business. He has a long time presence at FXCM, as he joined the company in 2011. He has served from multiple positions, but specializes in financial market analysis and commentary.
With his educational background in international relations, he emphasizes not only on Technical Analysis but also in Fundamental Analysis and Geopolitics – which have been having increasing impact on financial markets. He has longtime experience in market analysis and as a host of educational trading courses via online and in-person sessions and conferences.
Any opinions, news, research, analyses, prices, other information, or links to third-party sites contained on this website are provided on an "as-is" basis, as general market commentary and do not constitute investment advice. The market commentary has not been prepared in accordance with legal requirements designed to promote the independence of investment research, and it is therefore not subject to any prohibition on dealing ahead of dissemination. Although this commentary is not produced by an independent source, FXCM takes all sufficient steps to eliminate or prevent any conflicts of interests arising out of the production and dissemination of this communication. The employees of FXCM commit to acting in the clients' best interests and represent their views without misleading, deceiving, or otherwise impairing the clients' ability to make informed investment decisions. For more information about the FXCM's internal organizational and administrative arrangements for the prevention of conflicts, please refer to the Firms' Managing Conflicts Policy. Please ensure that you read and understand our Full Disclaimer and Liability provision concerning the foregoing Information, which can be accessed here.