GBPUSD declines as UK slips into technical recession

The UK economy has dipped into a technical recession with two straight quarters of negative growth. The Office of National statistics said UK GDP printed at -0.3% for the fourth quarter of 2023. This, after the previous quarter came in at -0.1%. All three sectors – services, production, and construction output – showed contraction for the quarter.
GBPUSD declined following the release of the quarterly GDP number. Yesterday, the pair also declined after UK inflation came in lower than anticipated.
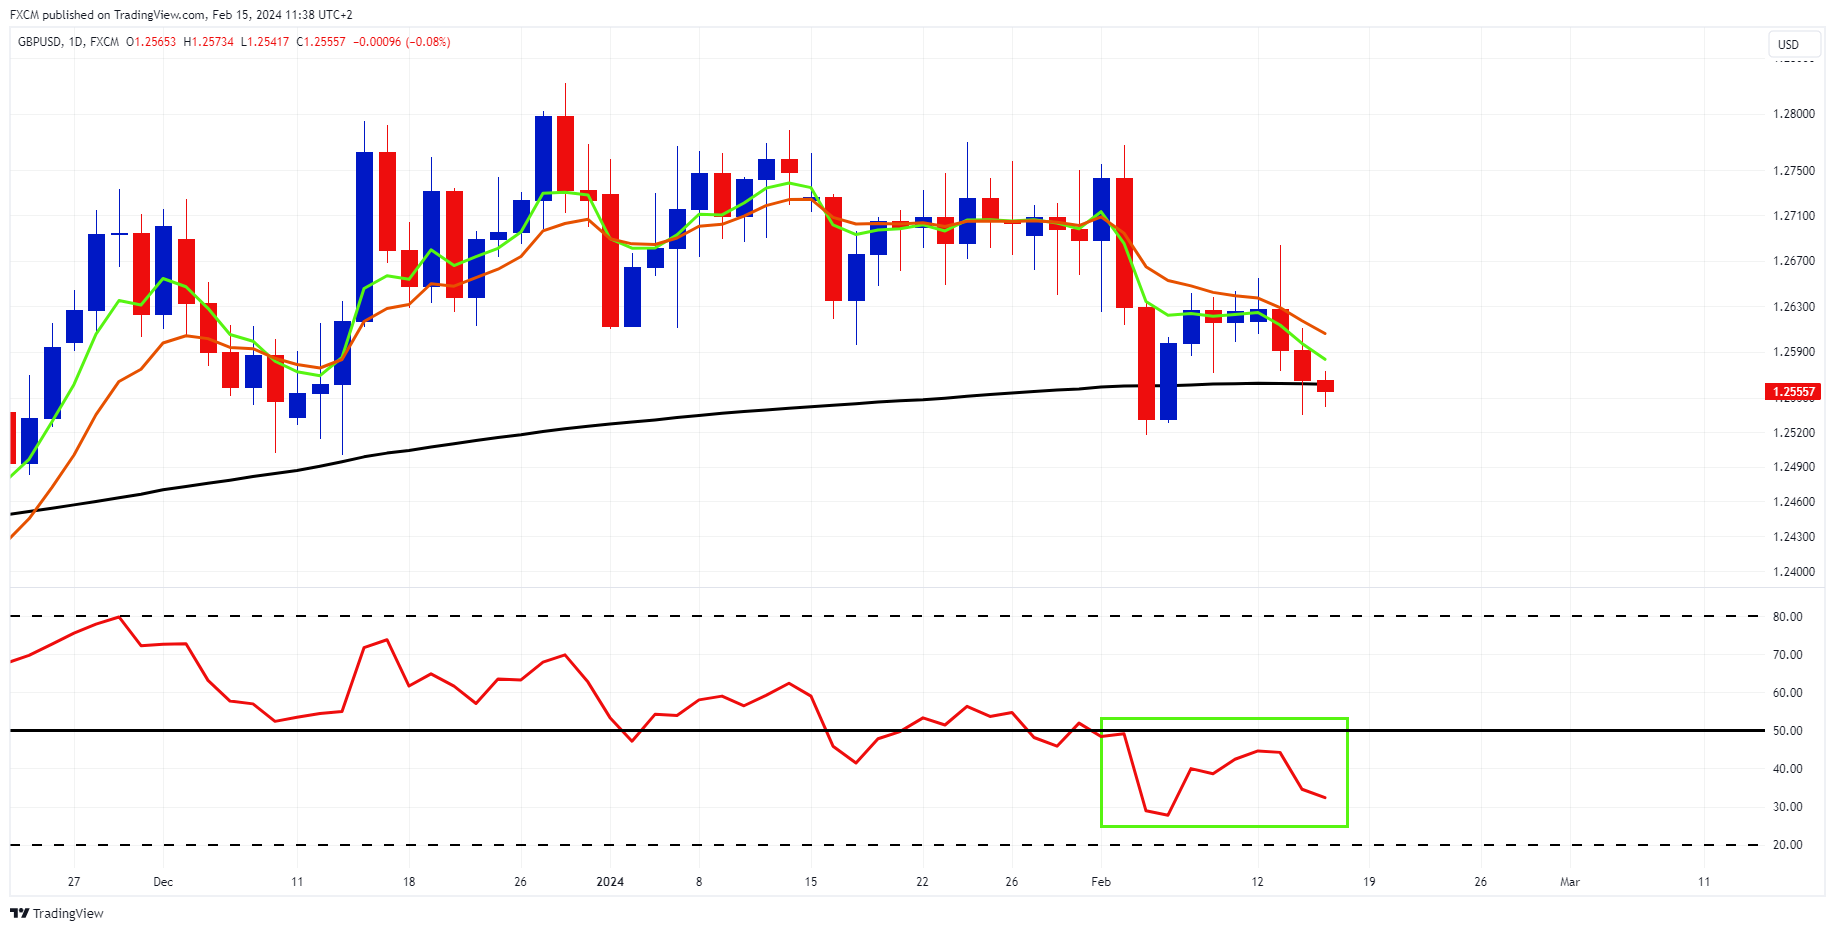
Source: www.tradingview.com
Technically, GBPUSD is testing its black 200-day simple moving average, perhaps suggesting a longer-term neutral reading for the forex pair.
However, there are some short-term bearish signs. GBPUSD's green 5-day EMA is bearishly below its orange 10-day EMA, with these EMAs showing angle and separation to the downside. Moreover, cable's daily RSI is below 50 (green rectangle), which is the bearish side of the indicator. The longer the RSI remains below 50, the greater the likelihood that bearish momentum will be applied to GBPUSD, keeping the forex pair under pressure.

Russell Shor
Senior Market Specialist
Russell Shor joined FXCM in October 2017 as a Senior Market Specialist. He is a certified FMVA® and has an Honours Degree in Economics from the University of South Africa. Russell is a full member of the Society of Technical Analysts in the United Kingdom. With over 20 years of financial markets experience, his analysis is of a high standard and quality.
Any opinions, news, research, analyses, prices, other information, or links to third-party sites contained on this website are provided on an "as-is" basis, as general market commentary and do not constitute investment advice. The market commentary has not been prepared in accordance with legal requirements designed to promote the independence of investment research, and it is therefore not subject to any prohibition on dealing ahead of dissemination. Although this commentary is not produced by an independent source, FXCM takes all sufficient steps to eliminate or prevent any conflicts of interests arising out of the production and dissemination of this communication. The employees of FXCM commit to acting in the clients' best interests and represent their views without misleading, deceiving, or otherwise impairing the clients' ability to make informed investment decisions. For more information about the FXCM's internal organizational and administrative arrangements for the prevention of conflicts, please refer to the Firms' Managing Conflicts Policy. Please ensure that you read and understand our Full Disclaimer and Liability provision concerning the foregoing Information, which can be accessed here.