EURUSD reflecting relative Euro Area economic weakness

source: www.tradingview.com
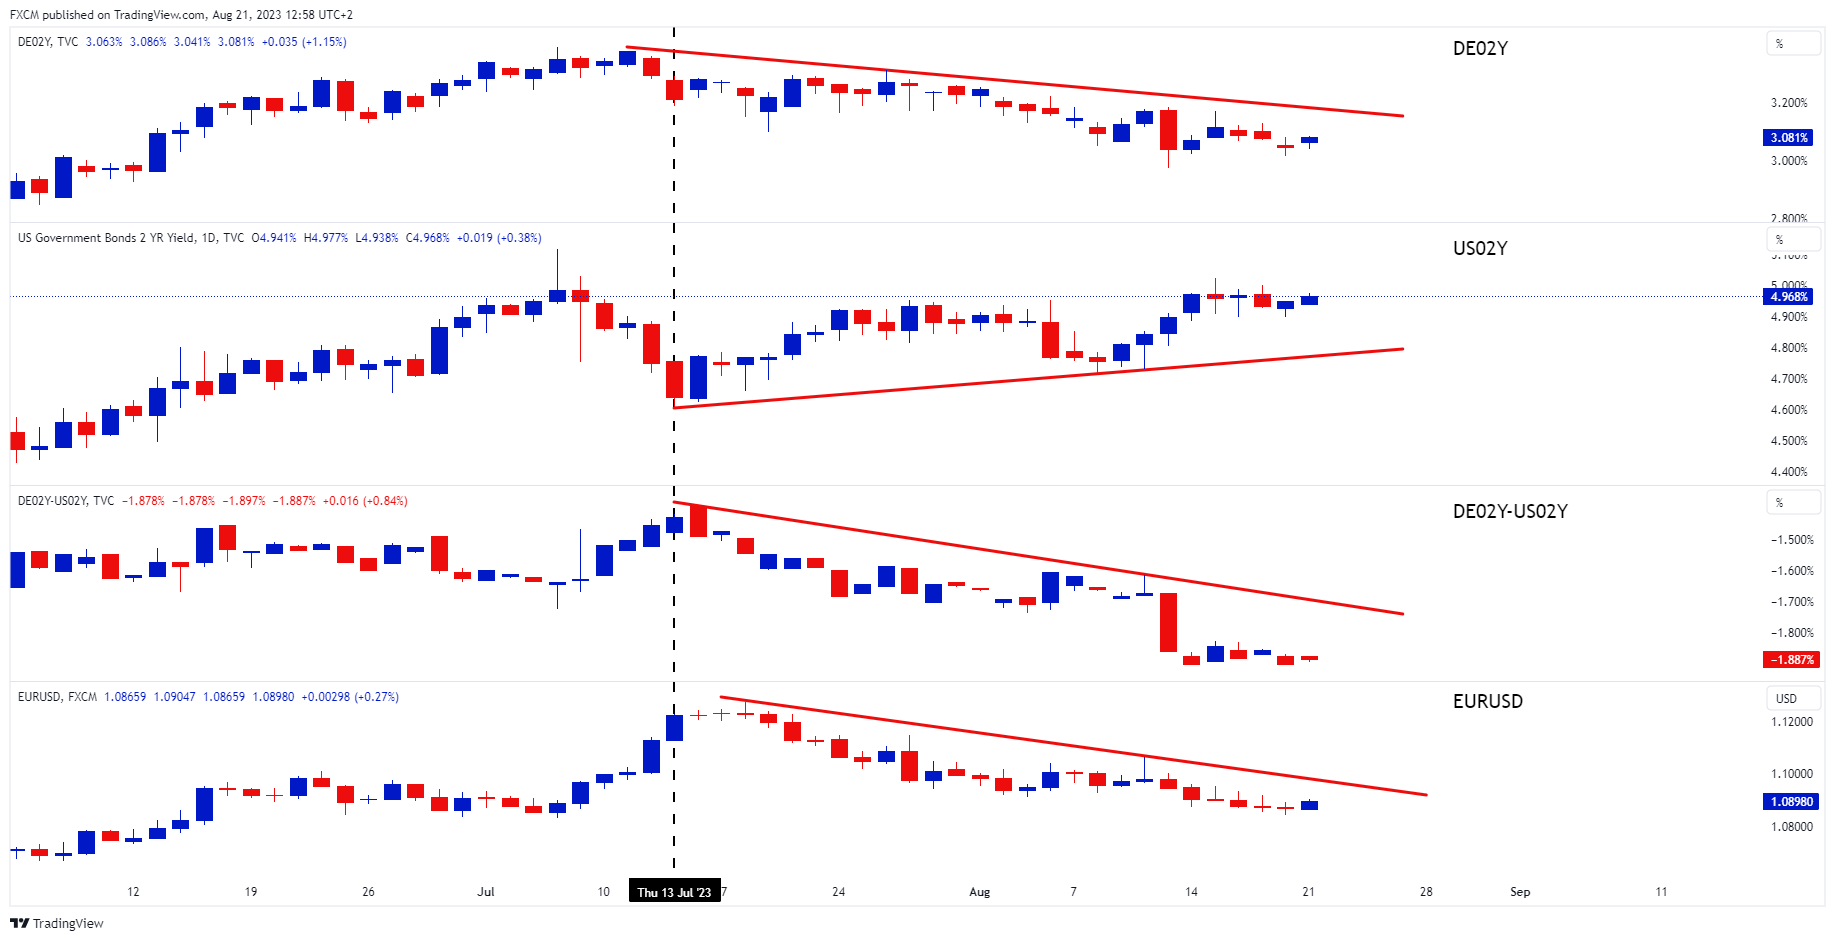
The 2-year yield serves as a good general proxy for monetary policy direction. The top chart shows the German 2-year yield, representing European monetary policy, and the chart underneath is the US 2-year yield. Since mid-July (black dashed verticals), the German 2-year has been trending down and the US 2-year has been trending up.
This seems to suggest that the ECB's monetary bias may be wavering, whilst the US's is suggestive of "higher for longer."
The third chart is the spread between the German 2-year and US-2 Year. Here, we see a declining trendline suggesting that the spread in narrowing in favour of the US 2-year yield.
The economic data between the two regions has diverged. The manufacturing PMI for the Euro Area is 42.7 suggesting contraction whilst the US's manufacturing PMI is 49, just shy of neutral. Retail sales (m/m) show a 0.3% decline for the Euro Area, whereas the US was up 0.7%. Moreover, the Euro Area's GDP is almost flat over the last seven quarters, whilst the US's quarterly GDP is a healthy 2.4%.
Based on the German 2-year yield, the weak economic data coming out of the Euro Area seems to be influencing ECB monetary policy. I.e., they are hampered in pursuing aggressive contractionary policy to combat high inflation due to economic weakness.
The bottom chart shows the EURUSD. As the 2-year spread (3rd chart) has declined so has the EURUSD. We suggest the relative economic weakness out of the Euro Area is acting as a headwind to the EURUSD. Wednesday will see flash PMIs for August, which may come in on the weak side. Friday has President Lagarde speaking at the Jackson Hole symposium.

Russell Shor
Senior Market Specialist
Russell Shor joined FXCM in October 2017 as a Senior Market Specialist. He is a certified FMVA® and has an Honours Degree in Economics from the University of South Africa. Russell is a full member of the Society of Technical Analysts in the United Kingdom. With over 20 years of financial markets experience, his analysis is of a high standard and quality.
Any opinions, news, research, analyses, prices, other information, or links to third-party sites contained on this website are provided on an "as-is" basis, as general market commentary and do not constitute investment advice. The market commentary has not been prepared in accordance with legal requirements designed to promote the independence of investment research, and it is therefore not subject to any prohibition on dealing ahead of dissemination. Although this commentary is not produced by an independent source, FXCM takes all sufficient steps to eliminate or prevent any conflicts of interests arising out of the production and dissemination of this communication. The employees of FXCM commit to acting in the clients' best interests and represent their views without misleading, deceiving, or otherwise impairing the clients' ability to make informed investment decisions. For more information about the FXCM's internal organizational and administrative arrangements for the prevention of conflicts, please refer to the Firms' Managing Conflicts Policy. Please ensure that you read and understand our Full Disclaimer and Liability provision concerning the foregoing Information, which can be accessed here.