EURUSD Primary Trend Analysis

The Primary Trend
The EURUSD monthly below (chart 1) has charted a lower peak followed by a lower trough - the classical definition of a downtrend. Due to the longer time scale, the primary trend for EURUSD is down. Until there is a change in the pair's primary trend, impulse moves down will be stronger than corrective moves up on the lower time frames. The stochastic is heading towards the lower quintile (blue rectangle). The RSI has also crossed to the bearish side of 50 (aqua ellipse). As the stochastic moves towards the blue rectangle, the underlying potential energy will be accumulating. If it maintains this level and the RSI remains under 50, there is a strong chance that this potential energy will turn to kinetic action, and the EURUSD declines further on a primary trend basis.
.png)
Chart 1
Past Performance: Past Performance is not an indicator of future results.
EU-US Spread
Chart 2 shows the spread between the German bund and the US10Y treasury on a weekly scale. A lower peak followed by a lower trough is evident on the chart. I.e., the yield spread indicates a widening gap, trending in favour of the US treasury. The spread reflects the distinct tonal difference between the ECB and the Fed.
On Friday, ECB President Lagarde, speaking at the Frankfurt European Banking Congress, reiterated that "the conditions to raise rates are very unlikely to be satisfied next year." However, the Fed minutes from their November meeting paints a very different picture for the US. The minute's summary indicates that officials are willing to hike rates "sooner than participants currently anticipated." They also show that some Fed officials feel a more aggressive tapering is appropriate.
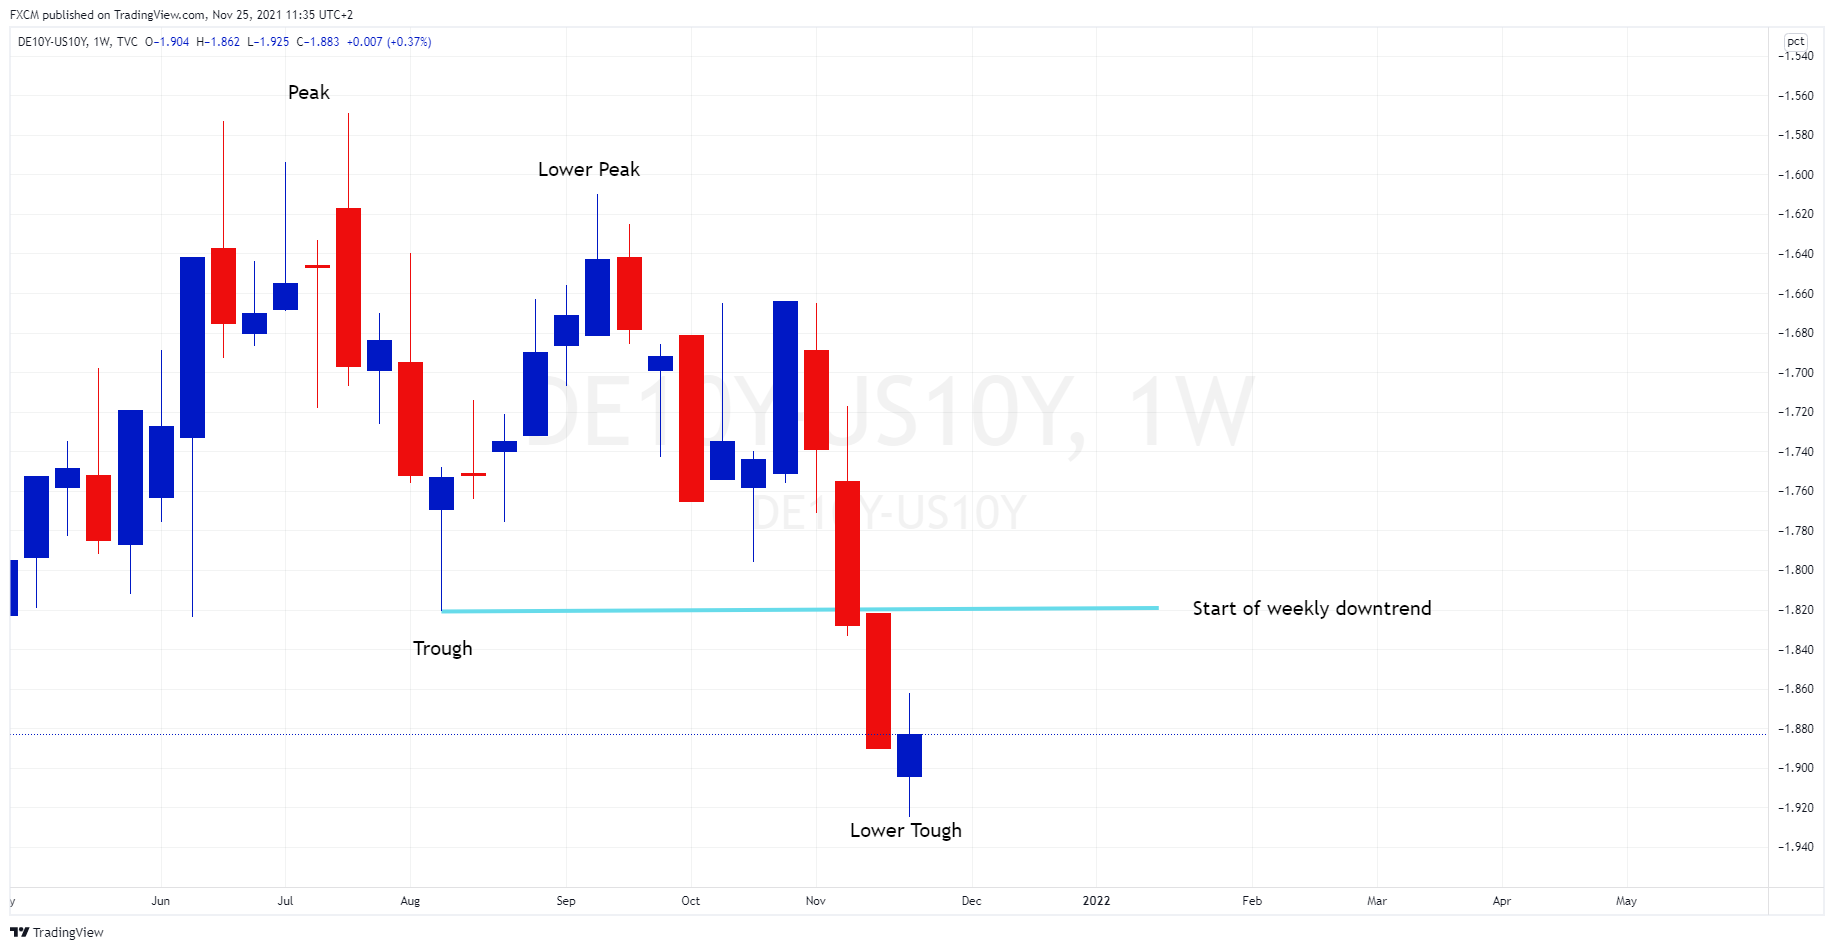
Chart 2
Source: www.tradingview.com
Past Performance: Past Performance is not an indicator of future results.
2s/10s
Chart 3 shows the 2/10 yield spread for the EU and US. The left chart shows that the EU yield curve is still suppressed. In fact, it has broken down over the past few days. The right chart shows the US yield curve to be in a much healthier state. It shows a robust steepening since October and has, in fact, broken out over the last few days. This is noteworthy as a steepening yield curve tends to indicate a more stable economic environment in the future.
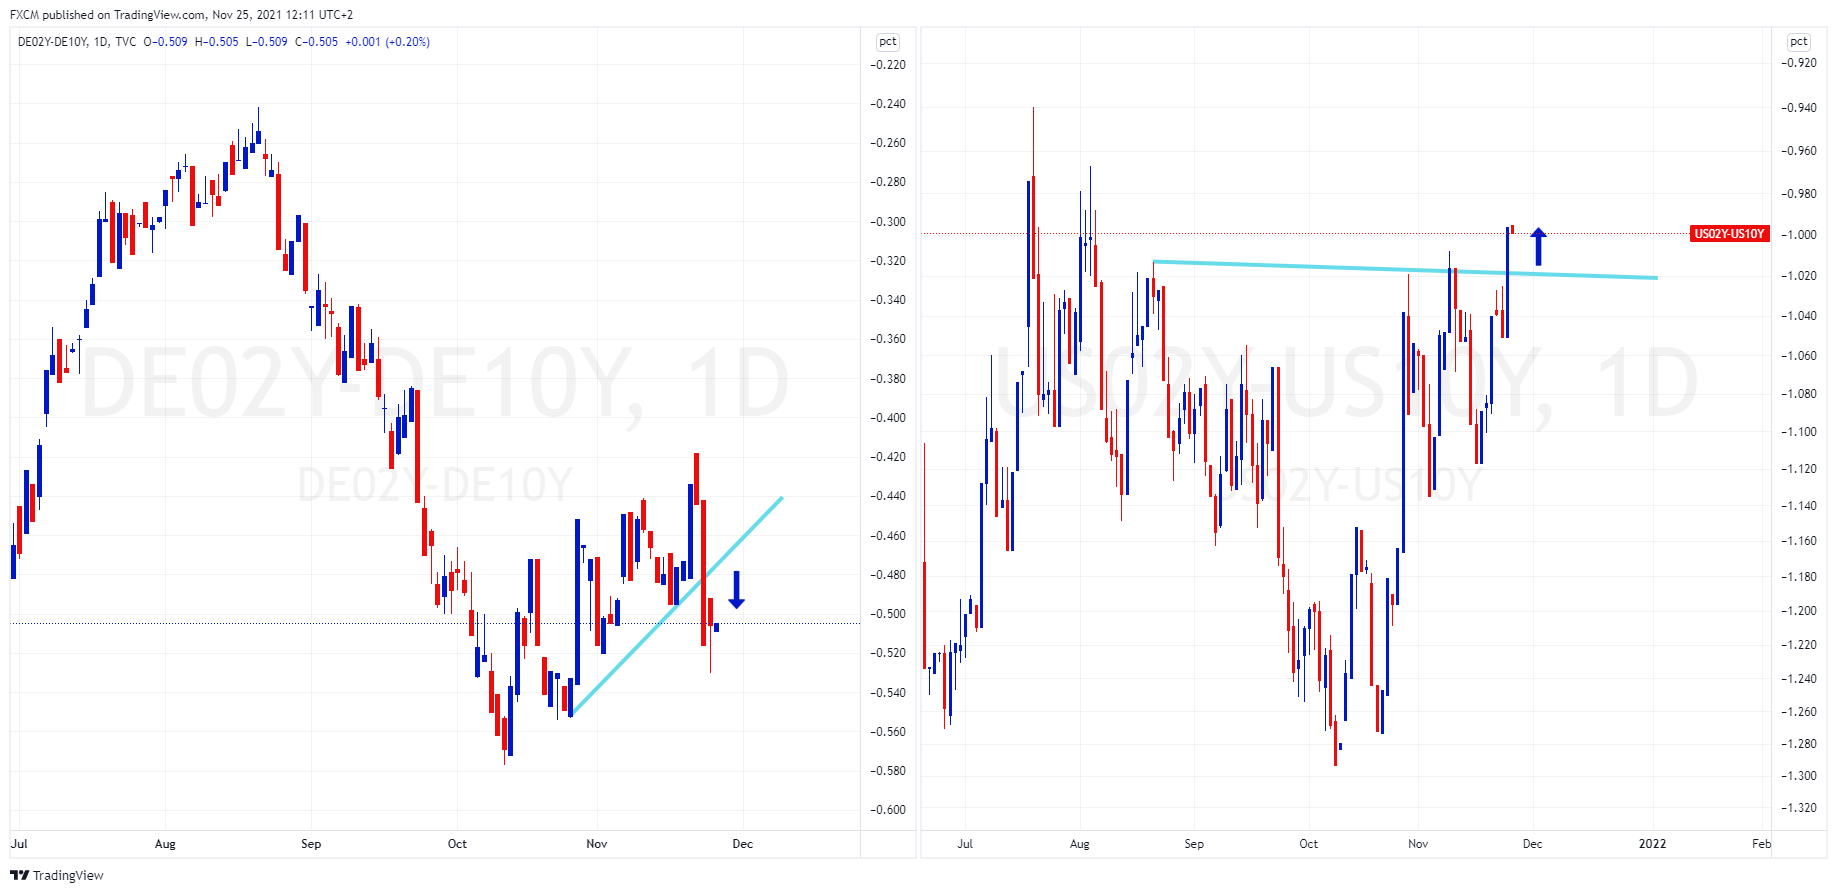
Chart 3
Source: www.tradingview.com
Past Performance: Past Performance is not an indicator of future results.
Weekly Chart Is Overbought
Chart 4 shows the capitulation in the EURUSD since July. The stochastic maintained its low level as the EURUSD declined by 4.6% (aqua studies). Moreover, the price trended in the weak area, as defined by the lower blue and lower red bands. However, the RSI has now pushed below 20 (blue rectangle), which is considered oversold. The RSI tends towards the Pareto principle, and, in the majority of cases, excess readings are not maintained for long. I.e. a pause in the downtrend as the RSI normalises will be considered as normal price behaviour and is expected.
.png)
Chart 4
Past Performance: Past Performance is not an indicator of future results.
Conclusion
The fundamentals are driving the primary trend. In this regard, the downtrend in the monthly price is supported by the economic conditions and differences between the EU and the US. However, the price will not move in a straight line and the weekly RSI suggests a correction is due. However, given the relative strength in the US's fundamentals, a EURUSD bounce is likely to be limited in scope. As such, resistance areas are likely to be compelling.
Further Sources:
cnbc.com

Russell Shor
Senior Market Specialist
Russell Shor joined FXCM in October 2017 as a Senior Market Specialist. He is a certified FMVA® and has an Honours Degree in Economics from the University of South Africa. Russell is a full member of the Society of Technical Analysts in the United Kingdom. With over 20 years of financial markets experience, his analysis is of a high standard and quality.
Any opinions, news, research, analyses, prices, other information, or links to third-party sites contained on this website are provided on an "as-is" basis, as general market commentary and do not constitute investment advice. The market commentary has not been prepared in accordance with legal requirements designed to promote the independence of investment research, and it is therefore not subject to any prohibition on dealing ahead of dissemination. Although this commentary is not produced by an independent source, FXCM takes all sufficient steps to eliminate or prevent any conflicts of interests arising out of the production and dissemination of this communication. The employees of FXCM commit to acting in the clients' best interests and represent their views without misleading, deceiving, or otherwise impairing the clients' ability to make informed investment decisions. For more information about the FXCM's internal organizational and administrative arrangements for the prevention of conflicts, please refer to the Firms' Managing Conflicts Policy. Please ensure that you read and understand our Full Disclaimer and Liability provision concerning the foregoing Information, which can be accessed here.