EURUSD H4 Chart Suggests Current Rally Faces Headwinds
EURUSD Price Action For November
.png)
Past Performance: Past Performance is not an indicator of future results.
The chart above considers the EURUSD H4 scale. The vertical line marks 1 November. Area 1 shows that the month had a bullish start to it, climbing near 65 pips. However, this was short-lived, as the EURD plunged for 10 candlesticks before finding support and rebounding (area 2). However, it stopped short of area 1, so that 3 was lower than 1 – a lower peak, charting on 9 November. The following day the EURSD capitulated (area 4). This was due to the CPI and core CPI prints that were released on 10 November. This capitulation resulted in a lower trough i.e., 4 being lower than 2. To be clear at this point:
· 3<1 and 4<2: a lower peak followed by a lower trough.
This is noteworthy as this defined the current trend of EURUSD for November. Since then, price action has resulted in area 5 and area 6. This has evolved the downtrend as follows:
· 3<1 and 4<2; 5<3 and 6<4: a series of lower peaks and lower troughs.
This makes area 5 the key level to watch. If the price manages to move above this level, it will disrupt the peak and trough series and the H4 downtrend will effectively end (but not necessarily result in an uptrend). However, we draw your attention to the shaded area below and to the right of key level 5. If the EURUSD runs into resistance within the shaded aqua, there are odds for the next lower peak charting. Ie. The current rally is regarded as suspicious until the key level is breached as shorts are likely to be looking for potential entry opportunities.
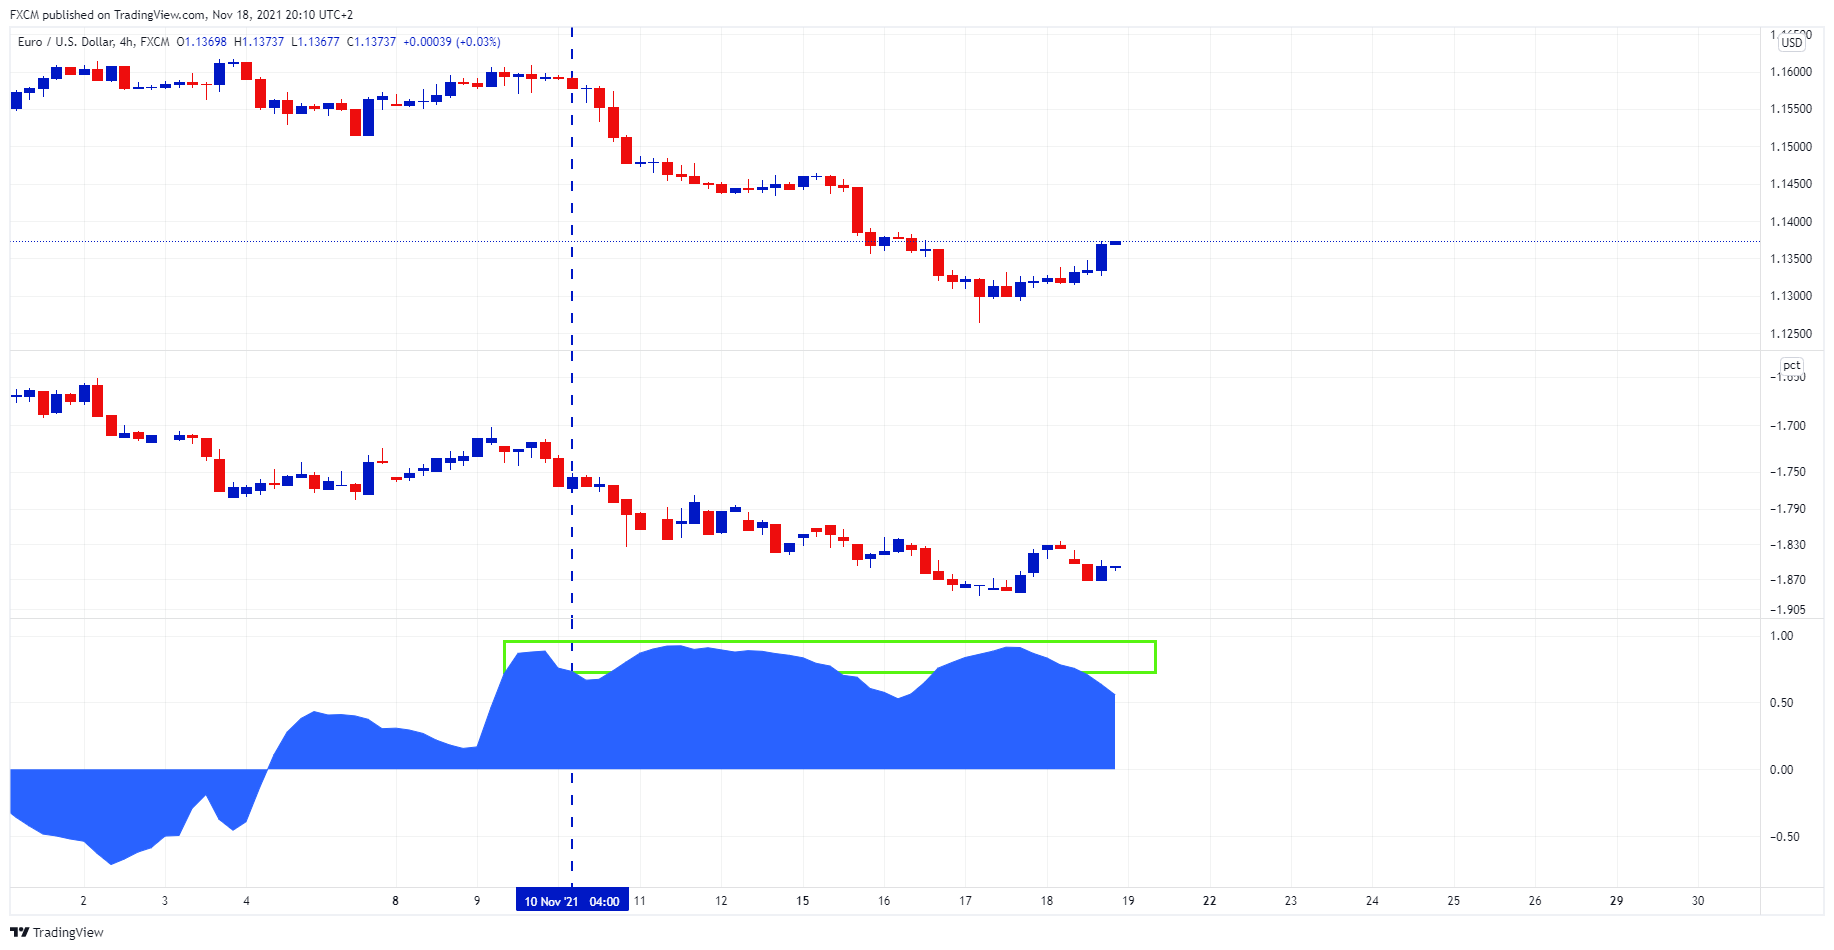
EURUSD And Bond Spreads
Past Performance: Past Performance is not an indicator of future results.
Source: www.tradingview.com
In this chart we are looking at the H4 scale of EURUSD in the top pane, the Bund/US10Y spread in the middle pane, and the correlation coefficient of the EURUSD to the spread in the bottom pane. The dashed blue vertical marks 10 November.
Once the inflation numbers were released, the US10Y started pulling away from the bund yield. These yields are nominal and instantaneously adjusted for inflation. At the same time, the forex market repriced the EURUSD, discounted the inflation news, and capital reallocated as per the new income levels. The bottom chart shows a marked increase in the correlation once the inflation numbers were printed.
Central banks have typically attributed a temporary status to inflation; however, trimmed mean prices show deeper and broader increases in the US than expected. The H4 charts show the ebb and flow of the trend progression for both the EURUSD pair and the yield spread. If the market continues to adjust for this November dynamic, rallies are likely to be very compelling indeed.

Russell Shor
Senior Market Specialist
Russell Shor joined FXCM in October 2017 as a Senior Market Specialist. He is a certified FMVA® and has an Honours Degree in Economics from the University of South Africa. Russell is a full member of the Society of Technical Analysts in the United Kingdom. With over 20 years of financial markets experience, his analysis is of a high standard and quality.
Any opinions, news, research, analyses, prices, other information, or links to third-party sites contained on this website are provided on an "as-is" basis, as general market commentary and do not constitute investment advice. The market commentary has not been prepared in accordance with legal requirements designed to promote the independence of investment research, and it is therefore not subject to any prohibition on dealing ahead of dissemination. Although this commentary is not produced by an independent source, FXCM takes all sufficient steps to eliminate or prevent any conflicts of interests arising out of the production and dissemination of this communication. The employees of FXCM commit to acting in the clients' best interests and represent their views without misleading, deceiving, or otherwise impairing the clients' ability to make informed investment decisions. For more information about the FXCM's internal organizational and administrative arrangements for the prevention of conflicts, please refer to the Firms' Managing Conflicts Policy. Please ensure that you read and understand our Full Disclaimer and Liability provision concerning the foregoing Information, which can be accessed here.