EURUSD drops below parity, but this is not the real story

Introduction
The EURUSD dropped briefly below parity today, reaching a low of 0.9999, before finding support. The last time the currency pair was this low was at the end of 2002. And whilst parity makes for an intesting topic of discussion, it isn't the real story. Concentrating on this level may detract from the underlying fundamentals. I.e., if the fundamentals warrant it, EURUSD will drop even further.
Central Bank Policies
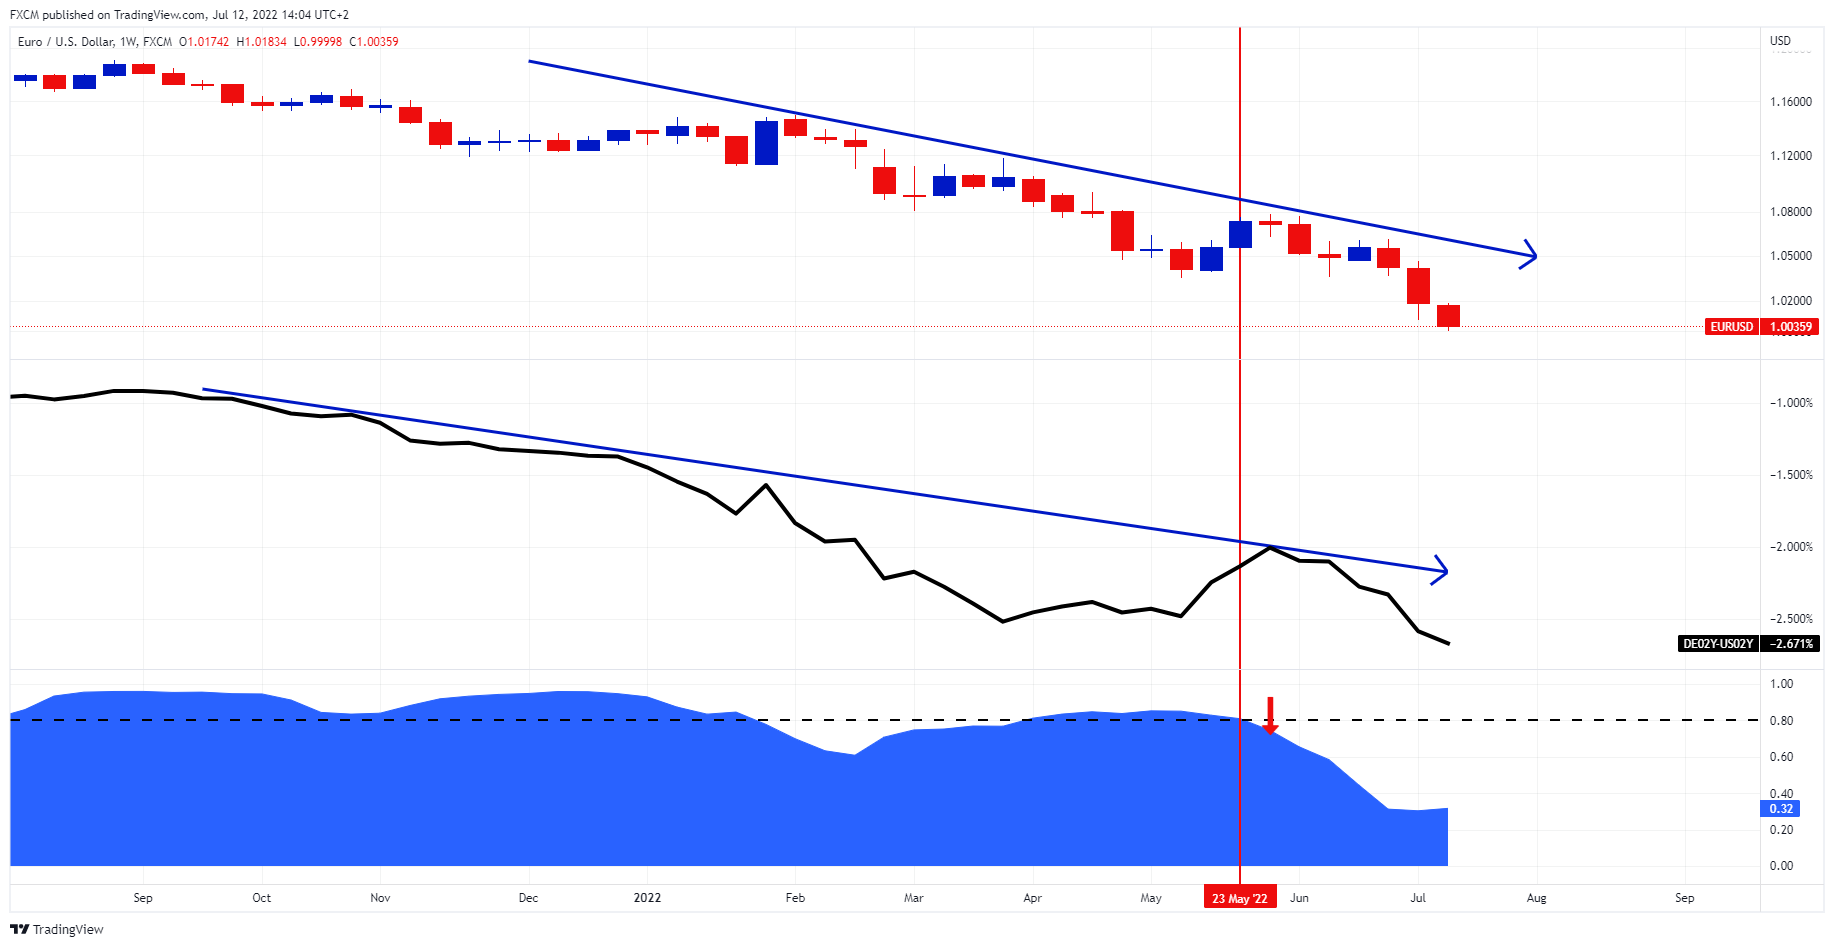
Source: www.tradingview.com
There is a stark difference in the respective approaches to monetary policies between the Federal Reserve and the European Central Bank. The middle chart above shows the spread between the US 2-yr and German 2-yr notes. This time frame is a good representation of monetary policy direction. The Fed's aggressive contractionary policy, and the ECB's late pivot toward hawkishness, have resulted in the spread trending down.
The EURUSD (top chart) followed closely as the currency headed towards parity. The bottom chart show's the correlation coefficient between the EURUSD and the spread. Again, it has a robust positive correlation, mostly above 80 (black dashed horizontal).
Interestingly, from 23 May (red dashed vertical), the correlation weakened and dropped below 80 (red down arrow). This disconnect was because the German 2-yr reacted to President Lagarde's hawkish blog post, where she laid out the path to policy normalisation. This response caused a bounce in the EURUSD. However, the correlation coefficient looks to have stabilised at 0.32. It may move upwards if the market thinks that the ECB will not be able to be as hawkish as initially communicated.
Global Trade
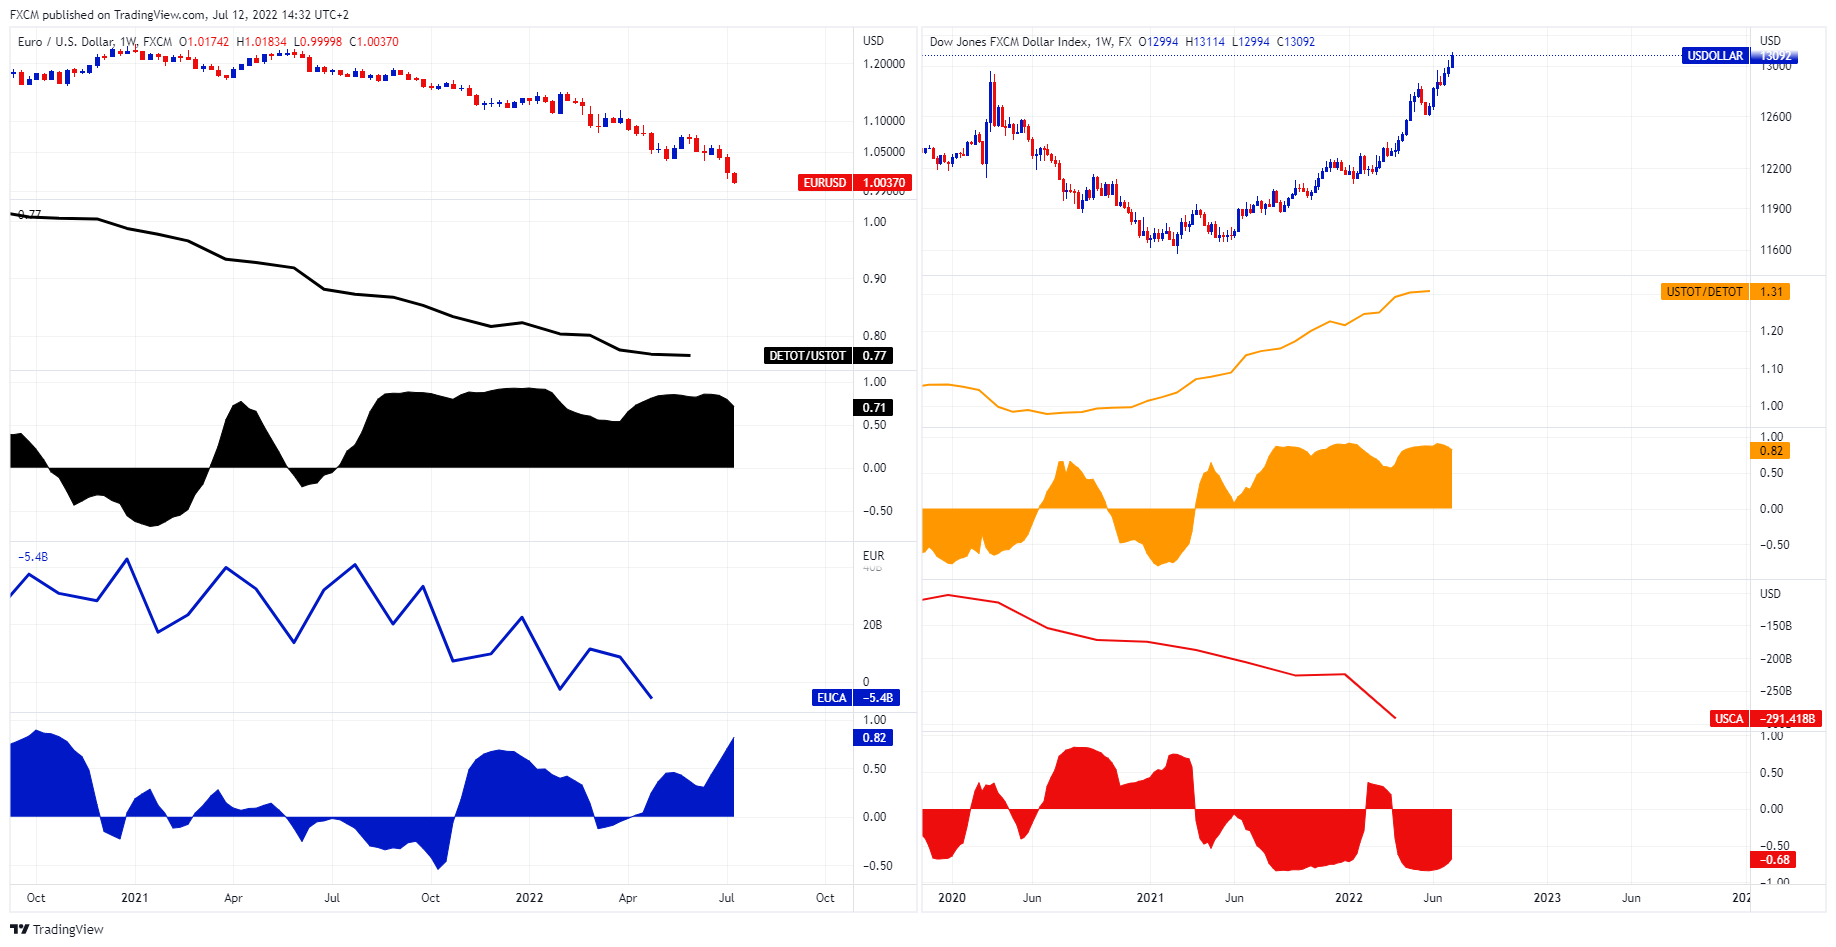
Source: www.tradingview.com
Global trade has also played a part in dollar strength and EURUSD's capitulation towards parity.
EURUSD
The chart on the left shows the EURUSD. In this article, we use Germany as a European trade proxy, as it accounts for approximately 23.6% of EU exports.
Black Charts
Underneath is the relative strength (RS1) of Germany's terms of trade (ToT) to the US's ToT (black line chart). Below is the correlation coefficient of the EURUSD to RS1.
The decline in Germany's ToT against the US's ToT closely correlates with the devaluation of the EURUSD. The current reading is 0.71.
Blue Charts
The blue line chart shows Germany's current account, which has a correlation coefficient to the EURUSD of 0.82. I.e. as the current account weakened so did the EURUSD. The weekly chart does seem to oscillate, but the monthly chart (not shown) has a more significant coefficient that started from February 2021, when the German current account topped (and the dollar bottomed).
USDOLLAR
The USDOLLAR chart is top right, bottoming in February 2021.
Orange Chart
Below the USDOLLAR is the US's ToT divided by Germany's ToT (RS2) (the inverse of the black line chart). Its correaltion coefficient to the USDOLLAR is a solid 0.82. I.e. as the US's ToT started to outperform, so did the USDOLLAR.
Red Chart
This line chart shows the US's current account. It has also declined markedly. However, its correlation coefficient with the USDOLLAR is -0.68. I.e., even though the US's current account eroded, the dollar wasn't affected. On the contrary, the greenback appreciated as the current account declined.
Conclusion
Monetary policy differentials are certainly contributing to the decline in the EURUSD. However, the erosion of Europe's terms of trade and current account also contributes meaningfully. In addition, the US is less sensitive to disruptions in international trade. This determination is made due to the improvement in its ToT, notwithstanding the drop in its current account. Therefore, as long as these two variables (monetary policy and trade) continue on their current trajectories, EURUSD will likely remain under pressure, despite parity.

Russell Shor
Senior Market Specialist
Russell Shor joined FXCM in October 2017 as a Senior Market Specialist. He is a certified FMVA® and has an Honours Degree in Economics from the University of South Africa. Russell is a full member of the Society of Technical Analysts in the United Kingdom. With over 20 years of financial markets experience, his analysis is of a high standard and quality.
Any opinions, news, research, analyses, prices, other information, or links to third-party sites contained on this website are provided on an "as-is" basis, as general market commentary and do not constitute investment advice. The market commentary has not been prepared in accordance with legal requirements designed to promote the independence of investment research, and it is therefore not subject to any prohibition on dealing ahead of dissemination. Although this commentary is not produced by an independent source, FXCM takes all sufficient steps to eliminate or prevent any conflicts of interests arising out of the production and dissemination of this communication. The employees of FXCM commit to acting in the clients' best interests and represent their views without misleading, deceiving, or otherwise impairing the clients' ability to make informed investment decisions. For more information about the FXCM's internal organizational and administrative arrangements for the prevention of conflicts, please refer to the Firms' Managing Conflicts Policy. Please ensure that you read and understand our Full Disclaimer and Liability provision concerning the foregoing Information, which can be accessed here.