EUR/USD Harmed by the Shift in Monetary Policy Dynamics

EUR/USD Analysis
Having started later and from a lower level than its US counterpart, the European Central Bank has been raising rates more aggressively during the current year. It has delivered 200 basis points of hikes, while the Fed has increased them by just 100 bps, in a divergence that had supported EUR/USD.
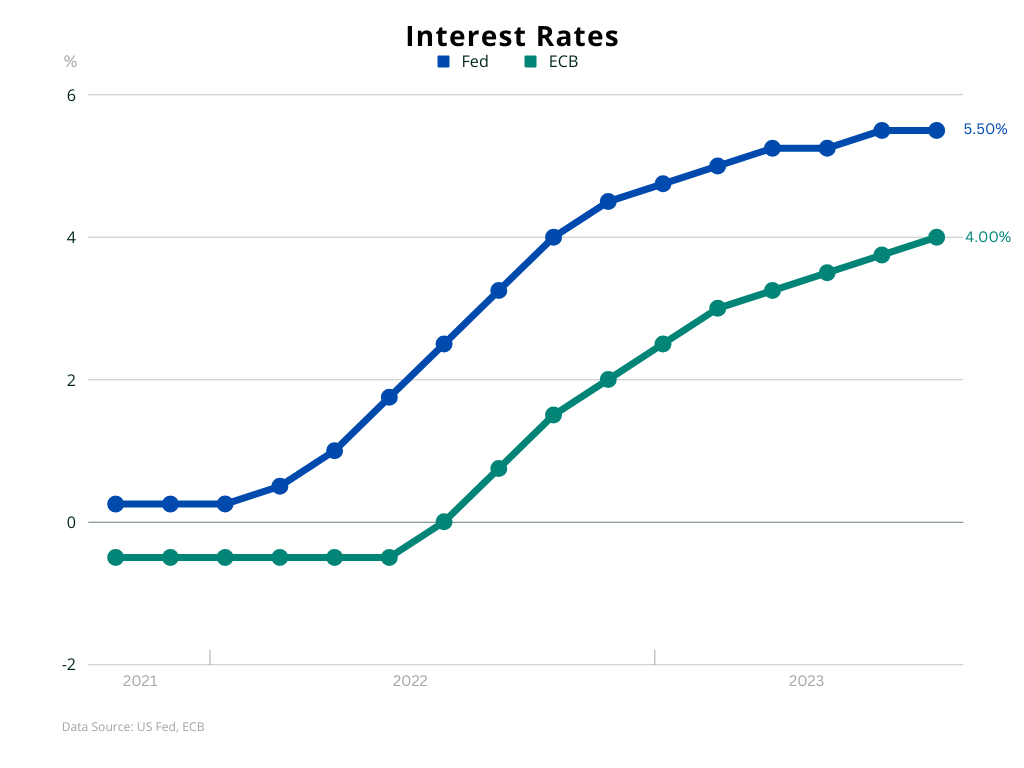
The favorable differential has been eroding over the last couple of months though, as European policymakers opened the door to a pause, whereas their peers from the other side of the Atlantic kept more tightening in play. After this month's latest round of policy decisions by both central banks, the Euro's waning rate advantage unraveled.
The ECB could not avoid its tenth straight rate increase, but hinted at peak rates. According to the policy statement, if the current levels are maintained for "a sufficiently long duration", will make a "substantial contribution" to the "timely return" of inflation to the 2% target. Policymakers are worried around the impact on the economy which is already struggling and they lowered their GDP forecast for this year and the next (0.7% and 1% respectively). [1]
Last week, the US Fed adopted an opposite approach, with a hawkish outlook that strengthened the higher-for-longer prospects. Officials maintained their 5.6% terminal rate forecast that implies one more hike this year. What's more, they raised they expectations for the next year, pointing to a tighter policy path and less cuts than previously thought.
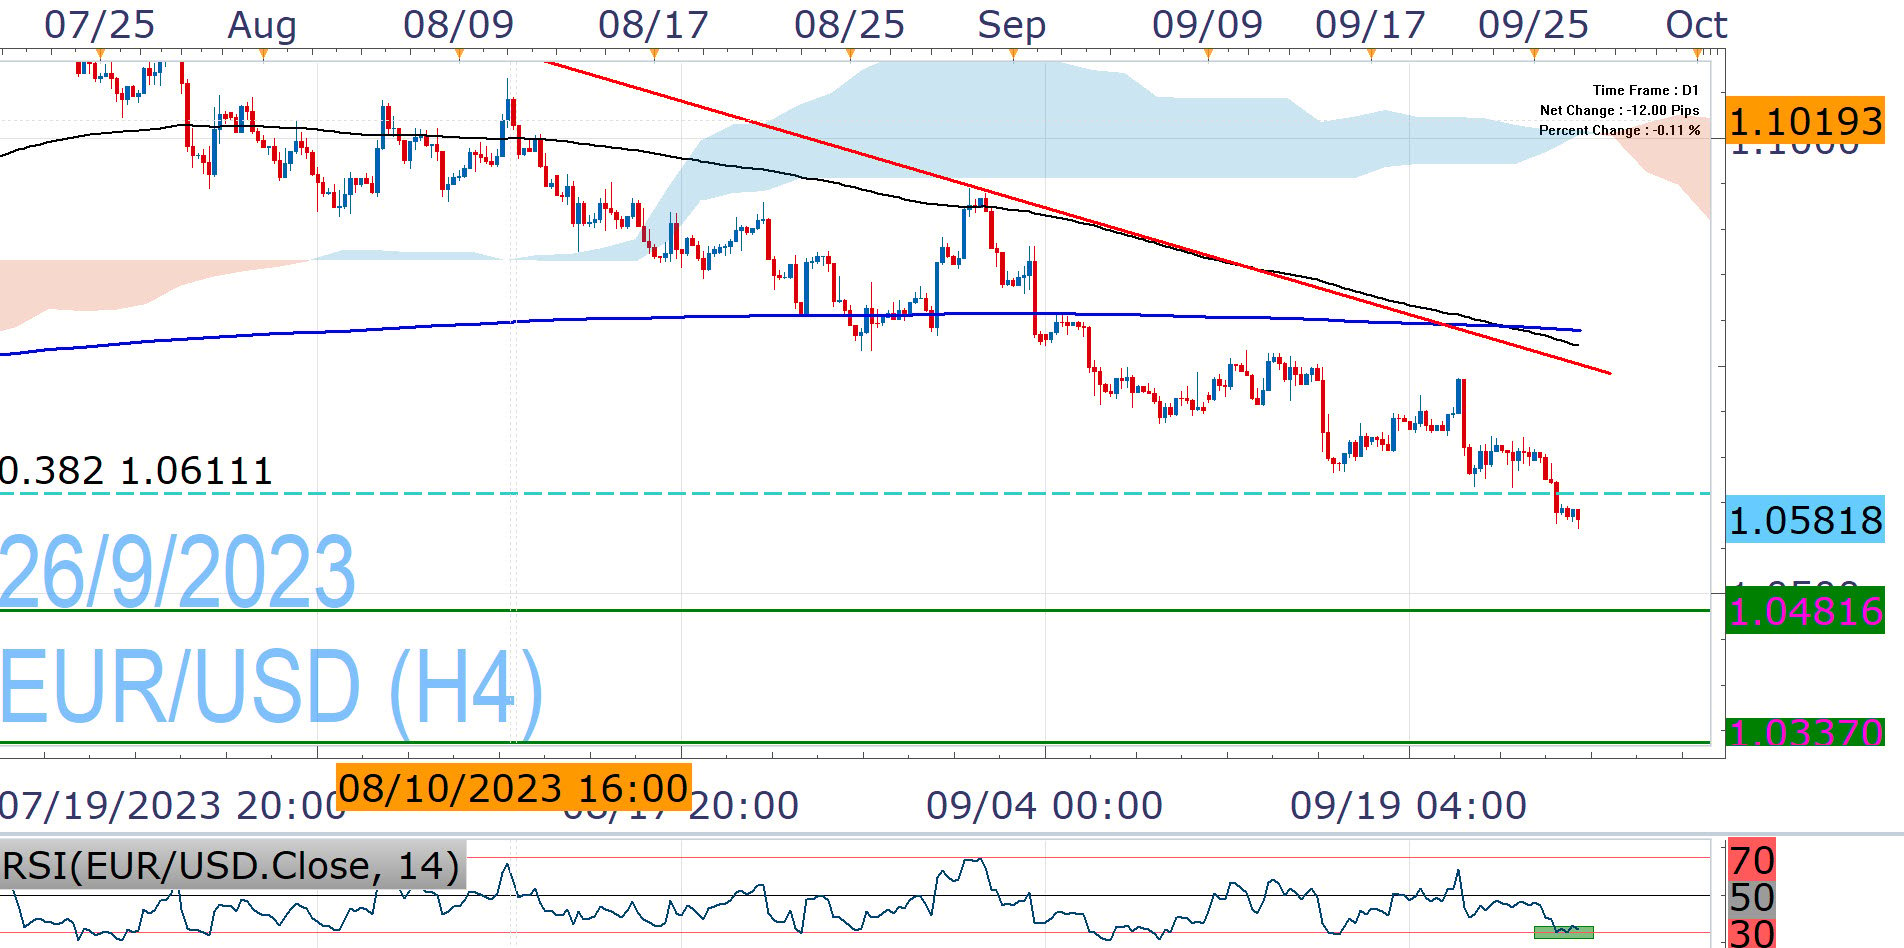
EUR/USD runs its second consecutive losing month due to the monetary policy repricing, reacting negatively to the ECB's dovish hike and the Fed hawkish hold. The technicals deteriorate further this week, since it moves below the critical 38.2% Fibonacci (of the2022 low/2023 high rise). This exposes the pair to the 2023 lows (1.0481), although we are cautious at this stage for greater slump that would tackle 1.0337.
The Daily chart adds to the gloom, since the pair is on the verge of a Death Cross, with the 50Days EMA close to moving below the 200DaysEMA. If formed, it could potentially lead to sustained weakness. The last time it had occurred was two years ago and the 2022 multi-year lows had followed.
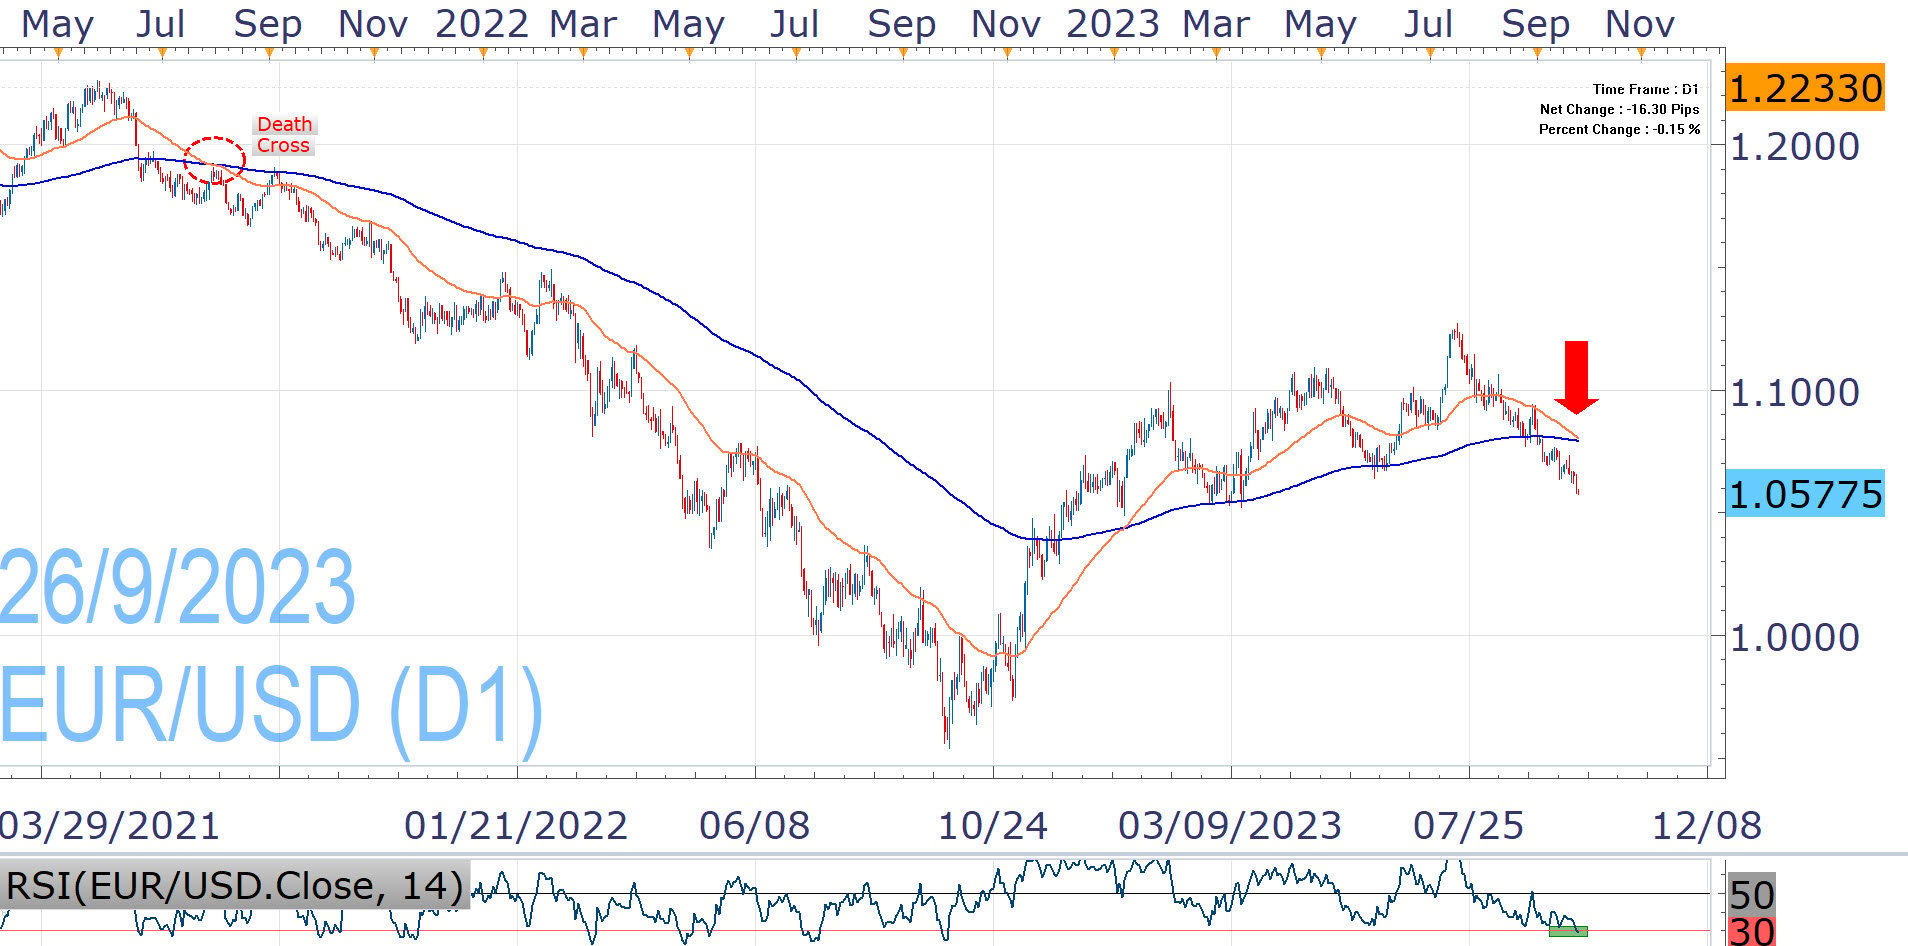
On the other hand, the Relative Strength Index (RSI) points toward oversold conditions on both D1 and H4 charts, so EUR/USD may find the chance to react. However, the upside looks unfriendly and a strong confluence of resistances looms at the 1.0740-90 region on the H4 chart.
Even though the ECB has hinted that the terminal rate could have now been reached, policymakers may have a hard time staying on the sidelines. Inflation remains very high and far from target. The Fed on the other hand, has stayed hawkish due to the better than expected performance of the economy and strong labor market. There has been some softening though, while workers' strikes and expected restart of student loan payments could dampen inflationary pressures. Furthermore, risk of government shutdown looms once again, which if materializes could damage the economy.

Nikos Tzabouras
Senior Financial Editorial Writer
Nikos Tzabouras is a graduate of the Department of International & European Economic Studies at the Athens University of Economics and Business. He has a long time presence at FXCM, as he joined the company in 2011. He has served from multiple positions, but specializes in financial market analysis and commentary.
With his educational background in international relations, he emphasizes not only on Technical Analysis but also in Fundamental Analysis and Geopolitics – which have been having increasing impact on financial markets. He has longtime experience in market analysis and as a host of educational trading courses via online and in-person sessions and conferences.
References
| Retrieved 06 May 2024 https://www.ecb.europa.eu/press/pressconf/2023/html/ecb.is230914~686786984a.en.html |
Any opinions, news, research, analyses, prices, other information, or links to third-party sites contained on this website are provided on an "as-is" basis, as general market commentary and do not constitute investment advice. The market commentary has not been prepared in accordance with legal requirements designed to promote the independence of investment research, and it is therefore not subject to any prohibition on dealing ahead of dissemination. Although this commentary is not produced by an independent source, FXCM takes all sufficient steps to eliminate or prevent any conflicts of interests arising out of the production and dissemination of this communication. The employees of FXCM commit to acting in the clients' best interests and represent their views without misleading, deceiving, or otherwise impairing the clients' ability to make informed investment decisions. For more information about the FXCM's internal organizational and administrative arrangements for the prevention of conflicts, please refer to the Firms' Managing Conflicts Policy. Please ensure that you read and understand our Full Disclaimer and Liability provision concerning the foregoing Information, which can be accessed here.