EUR/USD at Critical Tech Levels Ahead of EZ & US Inflation

EUR/USD Analysis
The pair took advantage of the greenback's demise last week and the more hawkish stance of the ECB towards unwinding the monetary tightening and staged a rebound that has brought it to critical tech levels. It tries to surpass the EMA200 and the 38.2% Fibonacci of the recent slide. Successful effort will pause the bearish bias and give it the opportunity to push towards 1.1017, but the upside is unfriendly and EUR/USD still does not inspire confidence around the ascending prospects.
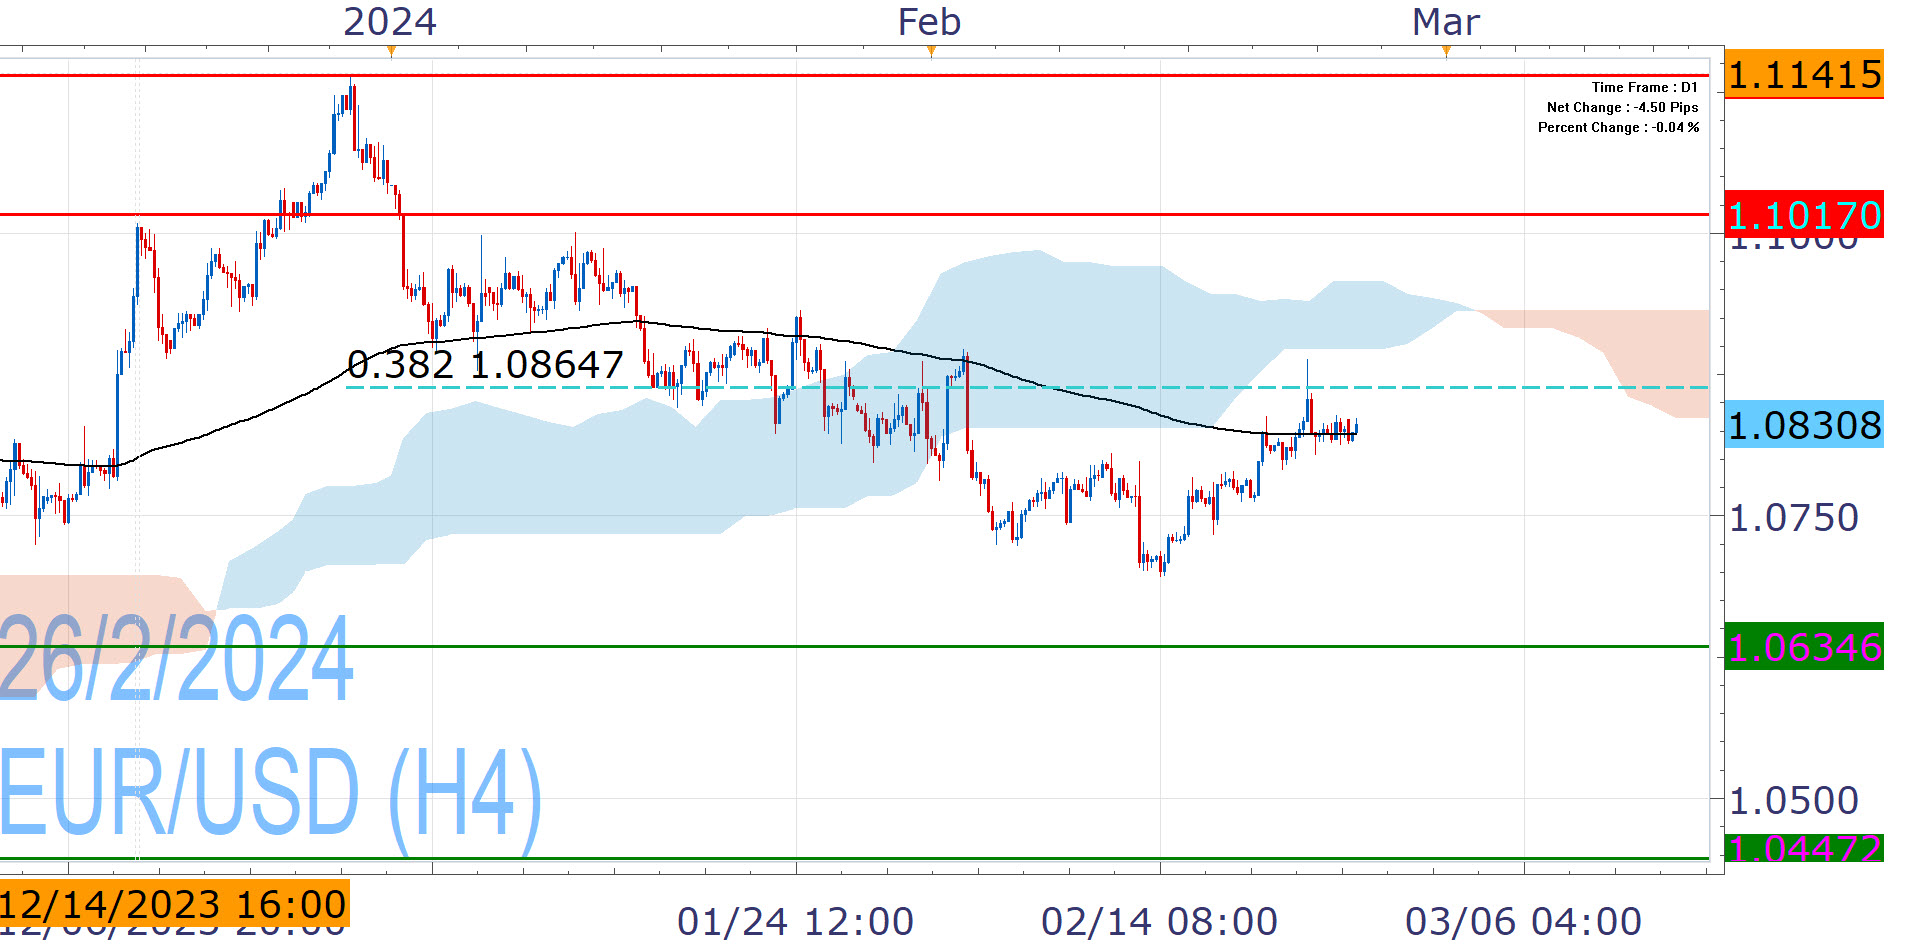
On the other hand, the Fed has shifted to conservative approach towards lower rates and markets bets have unraveled, now pricing in 75-100 basis points of cuts this year. Furthermore, the European Central Bank appears may be a better candidate to slash rates, given the weak economy. Below the 38.2% Fibonacci, immediate bias stays on the downside and risk of new lows (1.6946) persists, although sustained weakness past 1.0634 does not look easy.
The next leg of the move will likely be determined by the US PCE inflation update on Thursday and preliminary CPI inflation from Eurozone on Friday.

Nikos Tzabouras
Senior Financial Editorial Writer
Nikos Tzabouras is a graduate of the Department of International & European Economic Studies at the Athens University of Economics and Business. He has a long time presence at FXCM, as he joined the company in 2011. He has served from multiple positions, but specializes in financial market analysis and commentary.
With his educational background in international relations, he emphasizes not only on Technical Analysis but also in Fundamental Analysis and Geopolitics – which have been having increasing impact on financial markets. He has longtime experience in market analysis and as a host of educational trading courses via online and in-person sessions and conferences.
Any opinions, news, research, analyses, prices, other information, or links to third-party sites contained on this website are provided on an "as-is" basis, as general market commentary and do not constitute investment advice. The market commentary has not been prepared in accordance with legal requirements designed to promote the independence of investment research, and it is therefore not subject to any prohibition on dealing ahead of dissemination. Although this commentary is not produced by an independent source, FXCM takes all sufficient steps to eliminate or prevent any conflicts of interests arising out of the production and dissemination of this communication. The employees of FXCM commit to acting in the clients' best interests and represent their views without misleading, deceiving, or otherwise impairing the clients' ability to make informed investment decisions. For more information about the FXCM's internal organizational and administrative arrangements for the prevention of conflicts, please refer to the Firms' Managing Conflicts Policy. Please ensure that you read and understand our Full Disclaimer and Liability provision concerning the foregoing Information, which can be accessed here.