Ethereum Constructive Above Key Technicals

ETH/USD Analysis
Ethereum registered gains of around 60% during the first half of 2023 and even though the advance lost steam recently, the altcoin showed resiliency in a tightening regulatory environment. It was weighed by the SEC action against Binance [1] and Coinbase [2] in early-June, but managed to look past it.
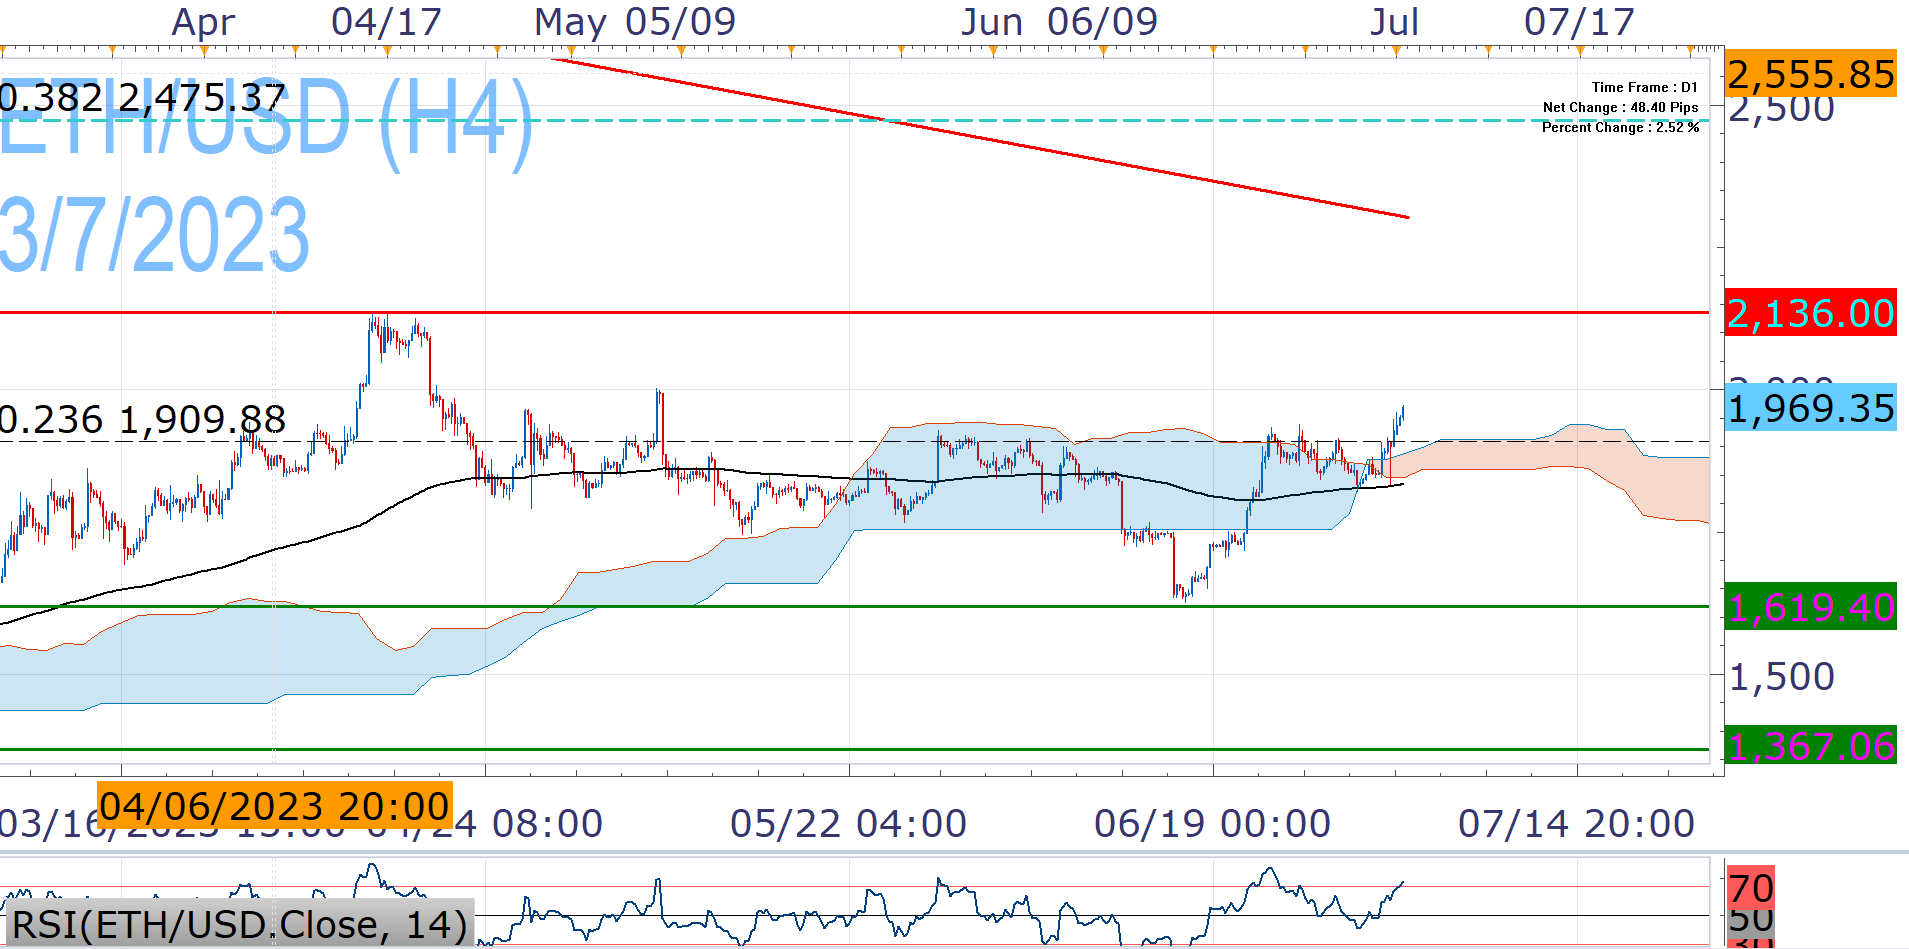
It closed last month above a critical area, which includes the EMA200, the daily Ichimoku Cloud and the 23.6% Fibonacci of the 2021 high/2022 low slump. This provides ETH/USD the opportunity to set new 2023 high and bring 38.2% Fibonacci in the spotlight. However, we are still cautious around those prospects and strong catalyst would be needed for such outcome.
The US Fed paused its rate hiking cycle recently but its updated projections suggest more hikes this year and Chair Powell has appeared increasingly hawkish recently, supporting the USDOLLAR. More to it, the Relative Strength Index (RSI) points to overbought conditions.
These factors can contain the ETH/USD advance, which has failed at the 23.6% Fibonacci several times before. This sustains risk for a return below the EMA200 that would make it vulnerable to 1,619, but the 2023 lows look distant (1,367).

Nikos Tzabouras
Senior Financial Editorial Writer
Nikos Tzabouras is a graduate of the Department of International & European Economic Studies at the Athens University of Economics and Business. He has a long time presence at FXCM, as he joined the company in 2011. He has served from multiple positions, but specializes in financial market analysis and commentary.
With his educational background in international relations, he emphasizes not only on Technical Analysis but also in Fundamental Analysis and Geopolitics – which have been having increasing impact on financial markets. He has longtime experience in market analysis and as a host of educational trading courses via online and in-person sessions and conferences.
References
| Retrieved 03 Jul 2023 https://www.sec.gov/news/press-release/2023-101 | |
| Retrieved 04 May 2024 https://www.sec.gov/news/press-release/2023-102 |
Any opinions, news, research, analyses, prices, other information, or links to third-party sites contained on this website are provided on an "as-is" basis, as general market commentary and do not constitute investment advice. The market commentary has not been prepared in accordance with legal requirements designed to promote the independence of investment research, and it is therefore not subject to any prohibition on dealing ahead of dissemination. Although this commentary is not produced by an independent source, FXCM takes all sufficient steps to eliminate or prevent any conflicts of interests arising out of the production and dissemination of this communication. The employees of FXCM commit to acting in the clients' best interests and represent their views without misleading, deceiving, or otherwise impairing the clients' ability to make informed investment decisions. For more information about the FXCM's internal organizational and administrative arrangements for the prevention of conflicts, please refer to the Firms' Managing Conflicts Policy. Please ensure that you read and understand our Full Disclaimer and Liability provision concerning the foregoing Information, which can be accessed here.