Bitcoin’s direction depends on the tone of Wednesday’s Fed release

Source: www.tradingview.com
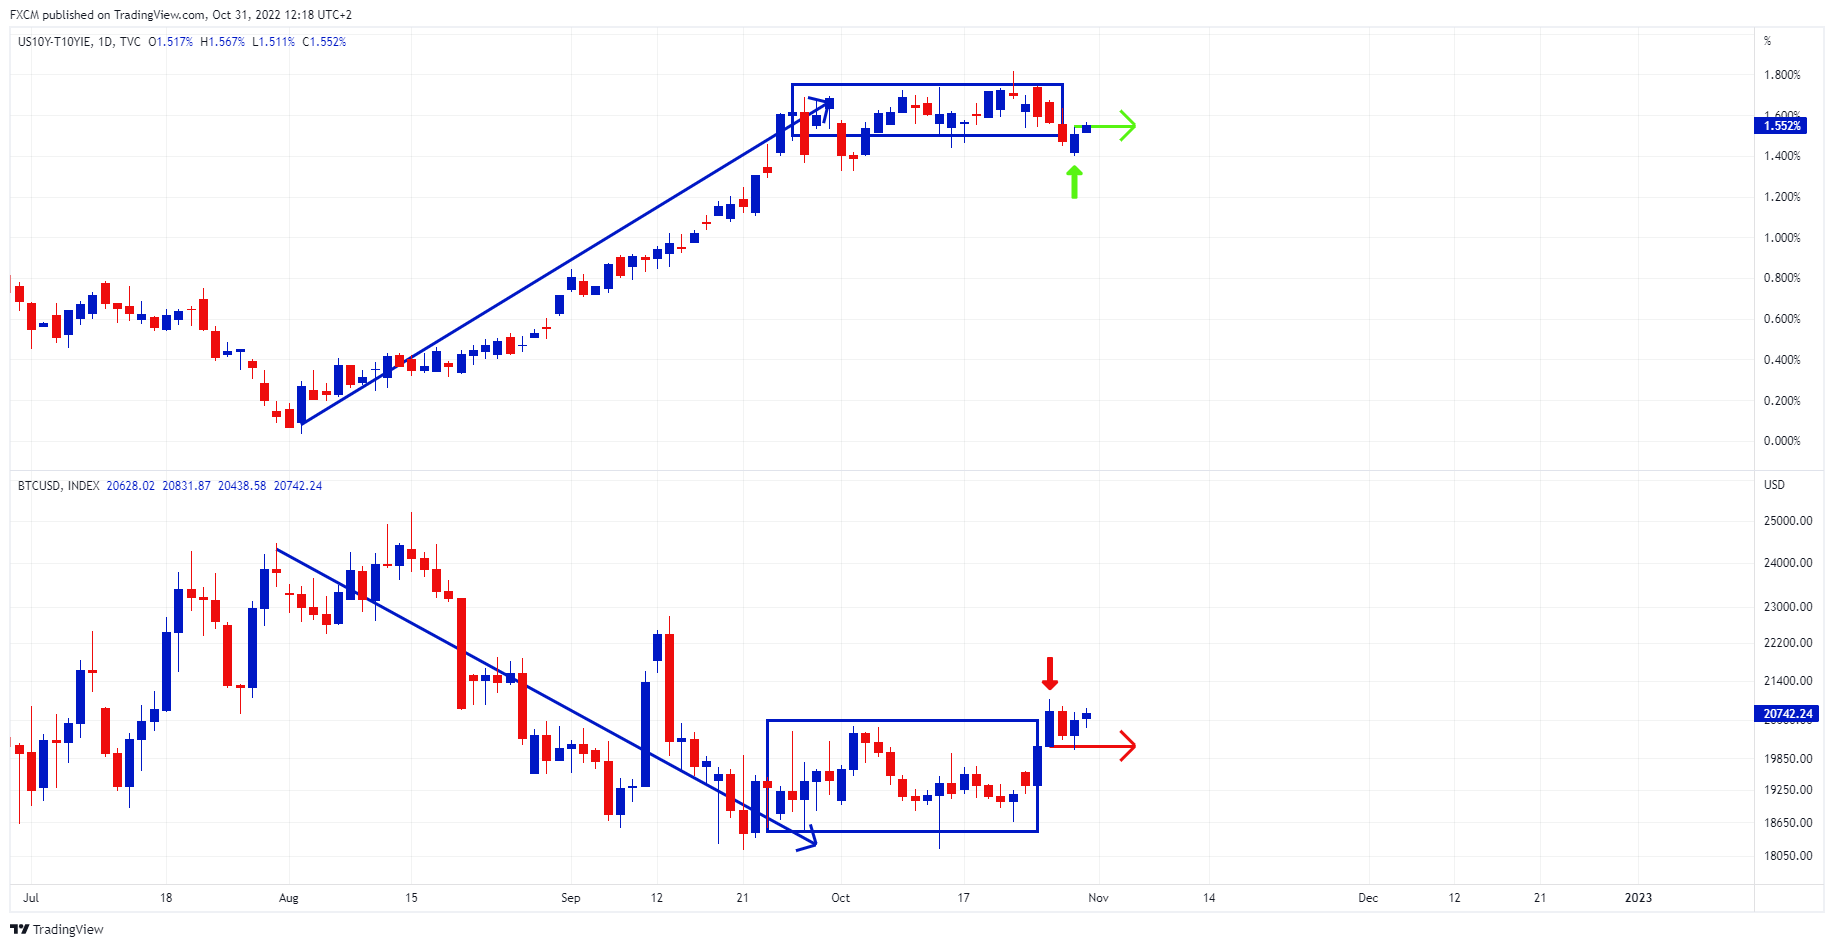
The top daily candlestick chart shows the 10-year real rate, and the bottom daily candlestick chart shows BTCUSD.
From August until two-thirds into September, the real rate appreciated and bitcoin depreciated (blue arrows). Over the last month, the two charts then moved sideways (blue rectangles).
The direction of the real rate has an inverse relationship to bitcoin and will tend to direct the price of the cryptocurrency based on its trend.
If the real rate continues to trend up, it will be a headwind for bitcoin. However, if it starts to moderate, BTCUSD will likely be supported.
Inflation remains a problem. Although lower than forecast, Friday's core PCE came in higher at 5.1% YoY than its previous print of 4.9% YoY. This backdrop makes the Fed meeting this week a huge event. It will likely hike another 75bps, the 4th such increase since June.
The market will listen to the statement's tone and Fed Chair Powell's press conference. How it is perceived will be market-moving. The real rate looks to be setting up for a trough (green arrow). If so, bitcoin may be charting a peak. I.e. if the tone is hawkish and the real rate moves up, bitcoin is likely to come under pressure.

Russell Shor
Senior Market Specialist
Russell Shor joined FXCM in October 2017 as a Senior Market Specialist. He is a certified FMVA® and has an Honours Degree in Economics from the University of South Africa. Russell is a full member of the Society of Technical Analysts in the United Kingdom. With over 20 years of financial markets experience, his analysis is of a high standard and quality.
Any opinions, news, research, analyses, prices, other information, or links to third-party sites contained on this website are provided on an "as-is" basis, as general market commentary and do not constitute investment advice. The market commentary has not been prepared in accordance with legal requirements designed to promote the independence of investment research, and it is therefore not subject to any prohibition on dealing ahead of dissemination. Although this commentary is not produced by an independent source, FXCM takes all sufficient steps to eliminate or prevent any conflicts of interests arising out of the production and dissemination of this communication. The employees of FXCM commit to acting in the clients' best interests and represent their views without misleading, deceiving, or otherwise impairing the clients' ability to make informed investment decisions. For more information about the FXCM's internal organizational and administrative arrangements for the prevention of conflicts, please refer to the Firms' Managing Conflicts Policy. Please ensure that you read and understand our Full Disclaimer and Liability provision concerning the foregoing Information, which can be accessed here.