Bitcoin Reasserts Long-Term Uptrend

Monthly Chart
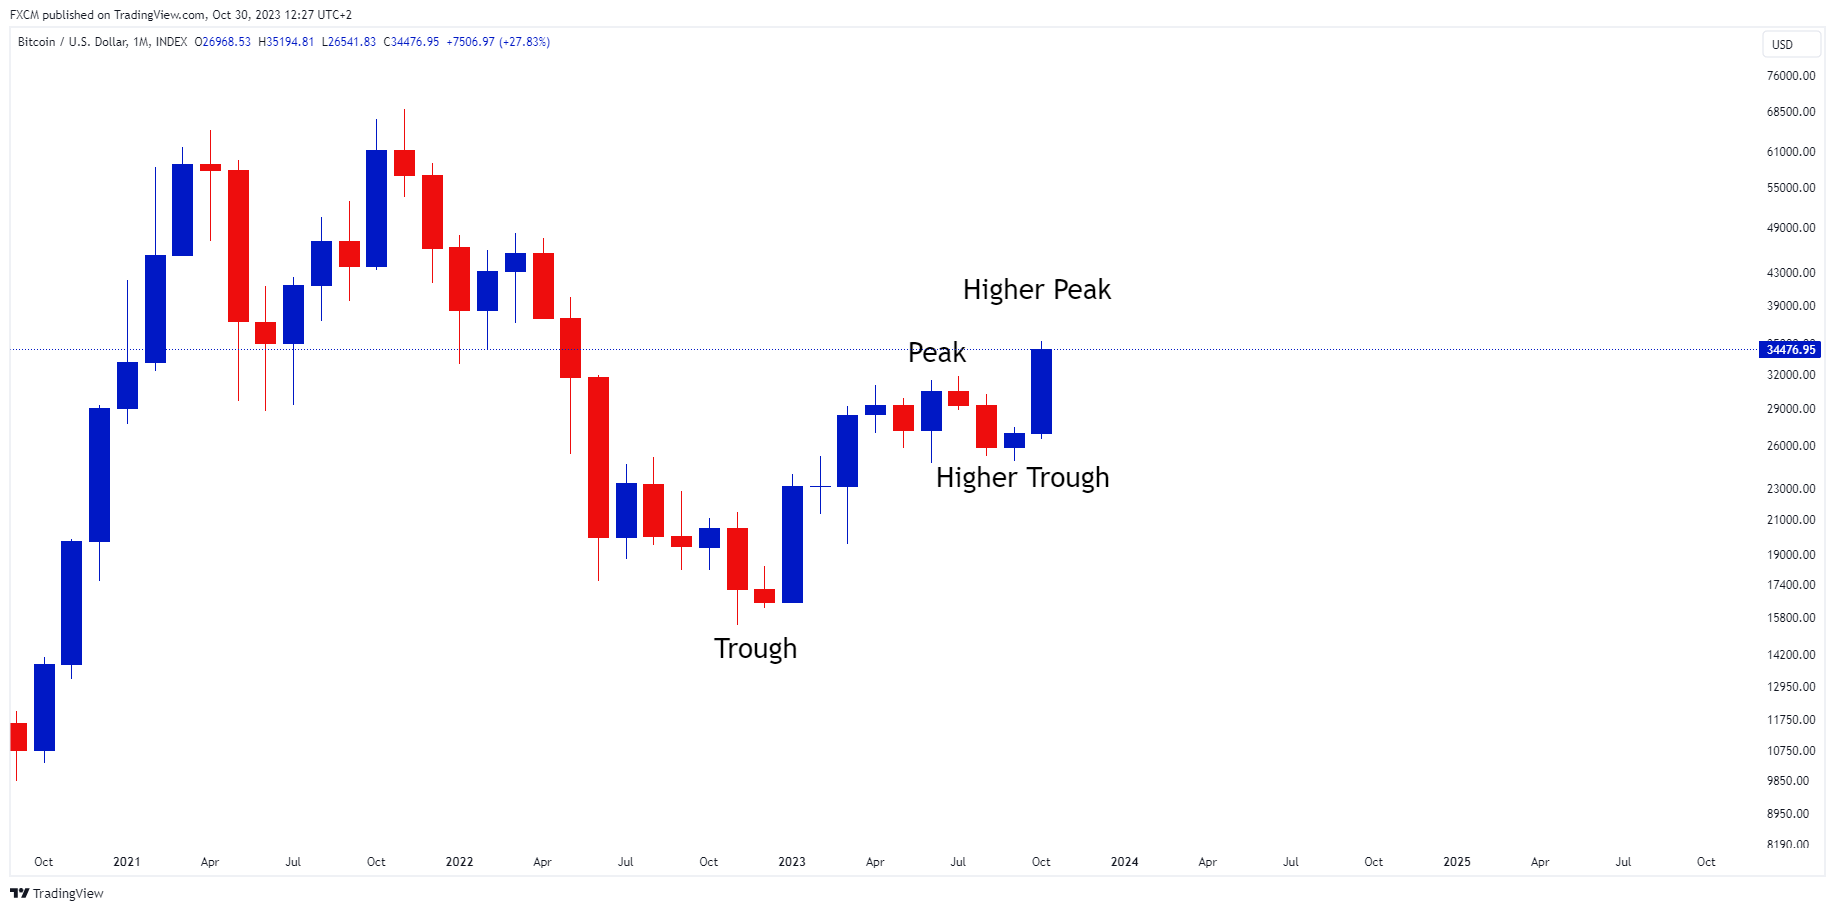
Source: wwww.tradingview.com
On a longer-term basis, bitcoin has reestablished its uptrend. It has charted a higher trough followed by a higher peak on its monthly chart. Bitcoin is trading near $34,550, which is close to last week's high of $35,194, and is up around 28% for October. The price appreciation is largely due an optimism that regulators will soon approve the first spot Bitcoin exchange-traded-fund (ETF).
However, it is worth noting that the FOMC statement release, and press conference will be on Wednesday, 1 Nov, and the Non-Farm Employment change will be on Friday. These may have a market moving effect on the cryptocurrency market.
Weekly Chart
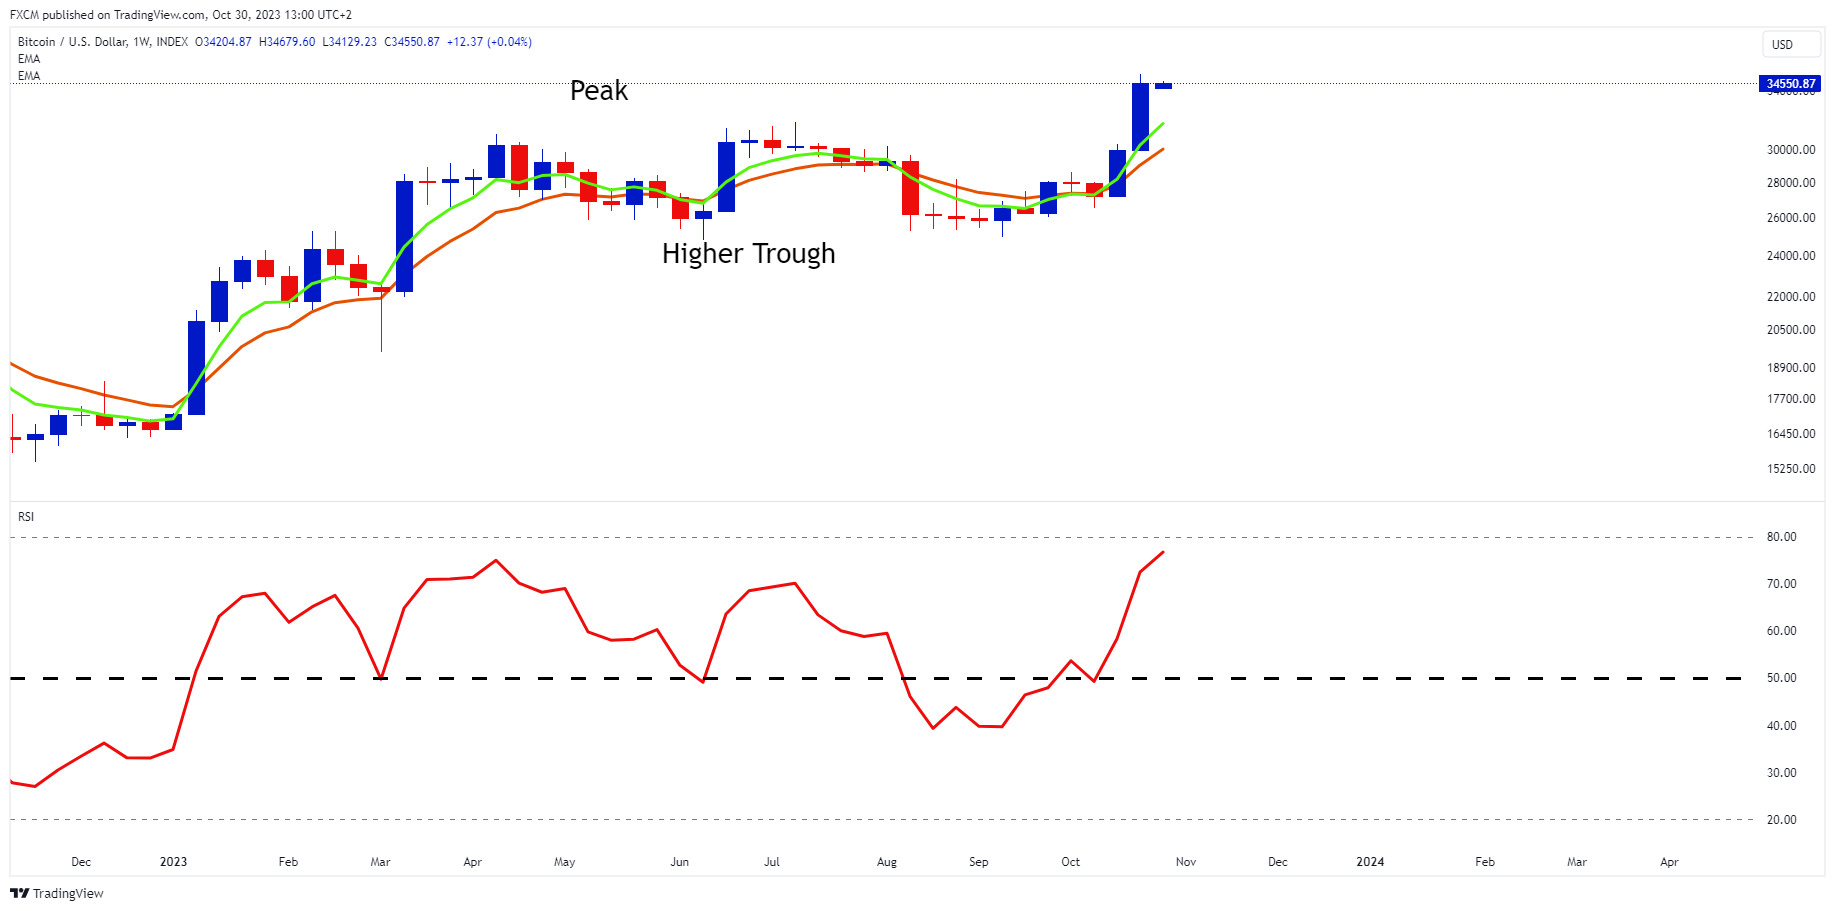
Source: www.tradingview.com
For now, the technical indicators are positive for Bitcoin. For example, the green 5-week EMA is above the orange 10-week EMA, with angle and separation. This puts Bitcoin's weekly EMAs into bull mode. Moreover, the weekly RSI is above 50, which is the bullish side of the indicator. The longer it maintains on this side, the great the momentum support for the cryptocurrency's price.

Russell Shor
Senior Market Specialist
Russell Shor joined FXCM in October 2017 as a Senior Market Specialist. He is a certified FMVA® and has an Honours Degree in Economics from the University of South Africa. Russell is a full member of the Society of Technical Analysts in the United Kingdom. With over 20 years of financial markets experience, his analysis is of a high standard and quality.
Any opinions, news, research, analyses, prices, other information, or links to third-party sites contained on this website are provided on an "as-is" basis, as general market commentary and do not constitute investment advice. The market commentary has not been prepared in accordance with legal requirements designed to promote the independence of investment research, and it is therefore not subject to any prohibition on dealing ahead of dissemination. Although this commentary is not produced by an independent source, FXCM takes all sufficient steps to eliminate or prevent any conflicts of interests arising out of the production and dissemination of this communication. The employees of FXCM commit to acting in the clients' best interests and represent their views without misleading, deceiving, or otherwise impairing the clients' ability to make informed investment decisions. For more information about the FXCM's internal organizational and administrative arrangements for the prevention of conflicts, please refer to the Firms' Managing Conflicts Policy. Please ensure that you read and understand our Full Disclaimer and Liability provision concerning the foregoing Information, which can be accessed here.