Bitcoin in bear mode following Fitch downgrade of US credit rating

Comment
- Bitcoin briefly rose above $30,000 after the Fitch downgrade of U.S. debt.
- Crypto enthusiasts saw this as a sign of reduced confidence in the traditional financial system and growing interest in decentralized alternatives.
- However, Bitcoin's price has since declined.
- The drop in digital assets aligns with a slide in the stock market.
- The Dow Jones Industrial Average and S&P 500 both fell on Wednesday.
- Both indices were anticipated to decline further on Thursday due to higher Treasury yields.
Daily Technical Analysis
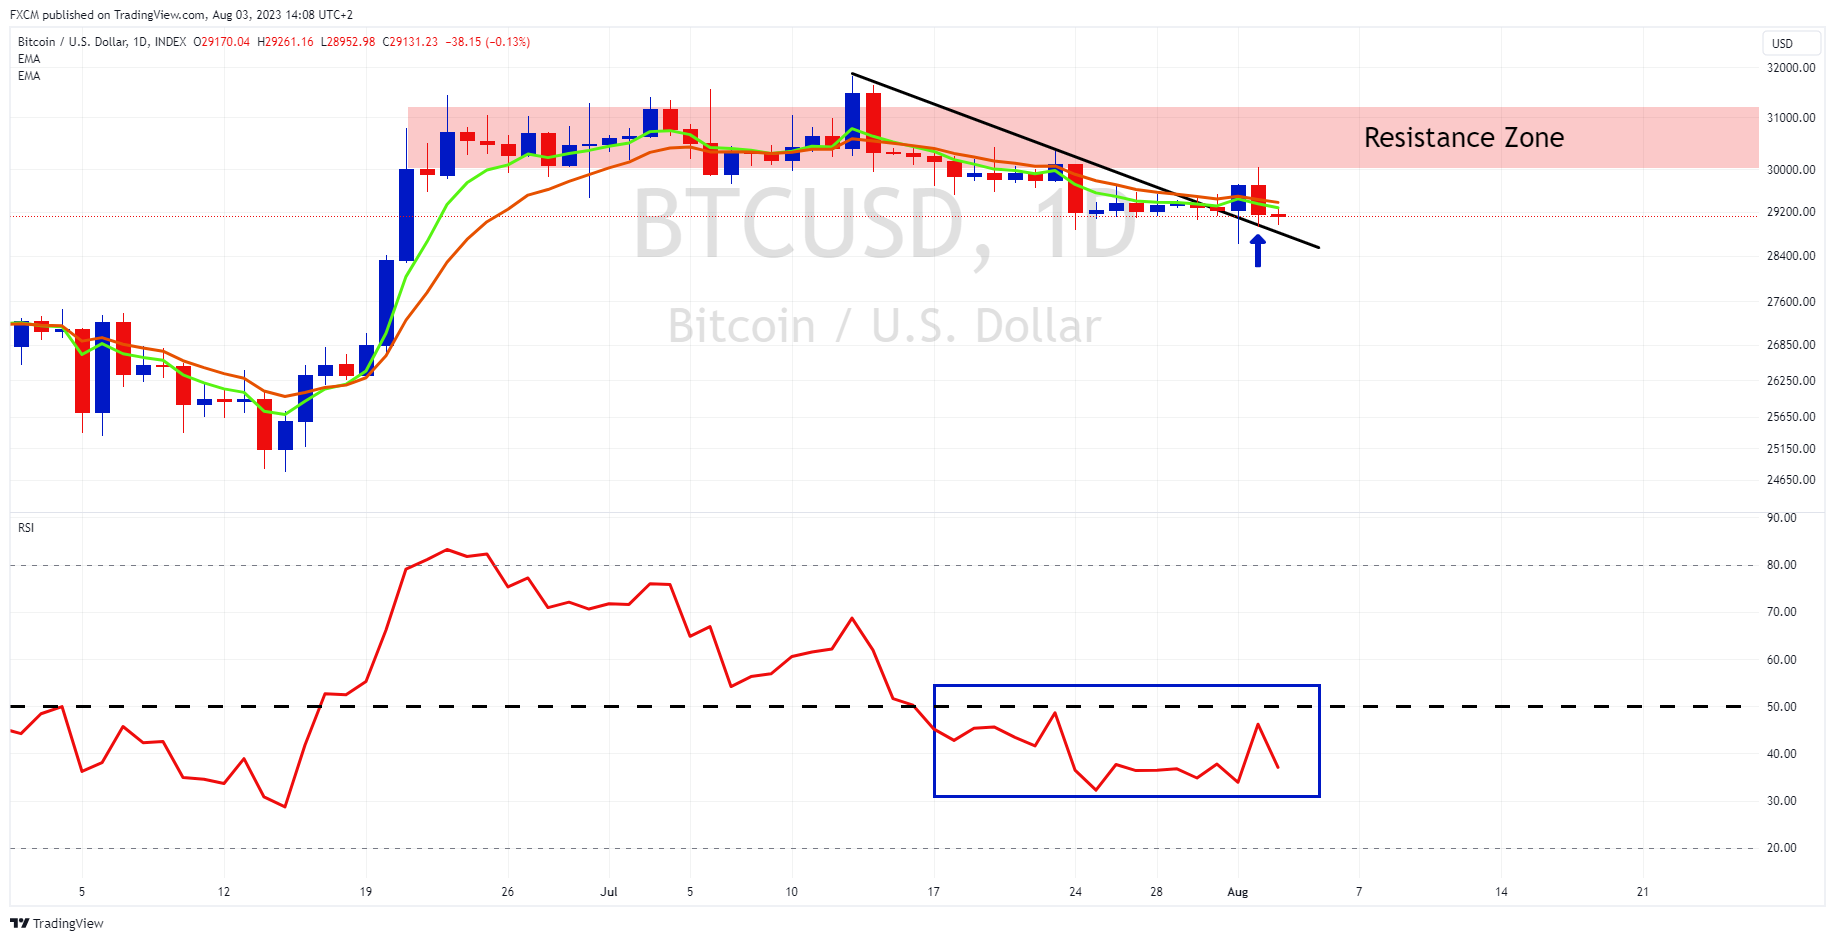
Source: www.tradingview.com
- There is substantial overhead resistance between 30,000-31,000 (red shaded area), with 30,000 being regarded as an important psychological level.
- The green 5-day EMA is below the orange 10-day EMA, putting the EMAs in bearish mode.
- The daily RSI is under 50 (blue rectangle), which suggests a current underlying bearish momentum.
- Bitcoin is feeling the pressure with other risk assets, following Fitch's downgrade of the US credit rating.
- Of interest, the bitcoin price has moved above its black downward sloping trendline. This suggests that the downwards momentum may be waning.
- However, the bearishness remains until a catalyst causes the EMAs to cross bullishly and for the RSI to pop above 50.

Russell Shor
Senior Market Specialist
Russell Shor joined FXCM in October 2017 as a Senior Market Specialist. He is a certified FMVA® and has an Honours Degree in Economics from the University of South Africa. Russell is a full member of the Society of Technical Analysts in the United Kingdom. With over 20 years of financial markets experience, his analysis is of a high standard and quality.
Any opinions, news, research, analyses, prices, other information, or links to third-party sites contained on this website are provided on an "as-is" basis, as general market commentary and do not constitute investment advice. The market commentary has not been prepared in accordance with legal requirements designed to promote the independence of investment research, and it is therefore not subject to any prohibition on dealing ahead of dissemination. Although this commentary is not produced by an independent source, FXCM takes all sufficient steps to eliminate or prevent any conflicts of interests arising out of the production and dissemination of this communication. The employees of FXCM commit to acting in the clients' best interests and represent their views without misleading, deceiving, or otherwise impairing the clients' ability to make informed investment decisions. For more information about the FXCM's internal organizational and administrative arrangements for the prevention of conflicts, please refer to the Firms' Managing Conflicts Policy. Please ensure that you read and understand our Full Disclaimer and Liability provision concerning the foregoing Information, which can be accessed here.